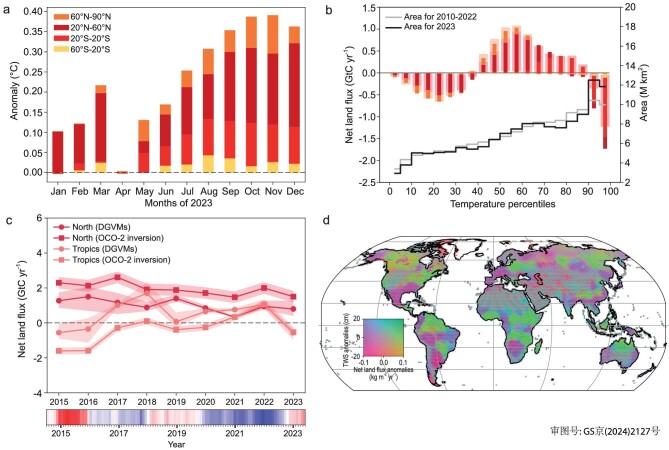
Figure 3.
(a) Land temperature warming anomaly each month in 2023 from the reference period 1991–2020 in four large latitude bands. (b) Land CO2 fluxes in 2010–2022 (wide bars) and in 2023 (inside bars) for each percentile of land temperature calculated during the reference period 1991–2020. The colors are for the same latitude bands as (a). The land area in each percentile is represented by the gray line in 2010–2022 and by the black line in 2023. (c) Changes in the declining northern land sink and the variations of tropical land flux with sources in 2015–2016 and 2023, from the bottom-up DGVMs and the OCO-2 inversion, during the period from 2015 to 2023. The ENSO index from NOAA Physical Sciences Laboratory (https://www.psl.noaa.gov/enso/mei) is represented at the bottom, with the extreme El Niño of 2015–2016, the La Niña from mid-2020 to mid-2023 and the moderate El Niño of the second half of 2023. (d) Bivariate maps of GRACE TWS anomalies and net land flux anomalies from OCO-2 inversion in 2023 compared with the 2015–2022 average, showing the coordination between carbon flux anomaly and water storage. Positive values in (b) and (c) indicate flux from the atmosphere to the land (carbon sink), while positive values in (d) represent increased land carbon sinks or increased total water storage.

