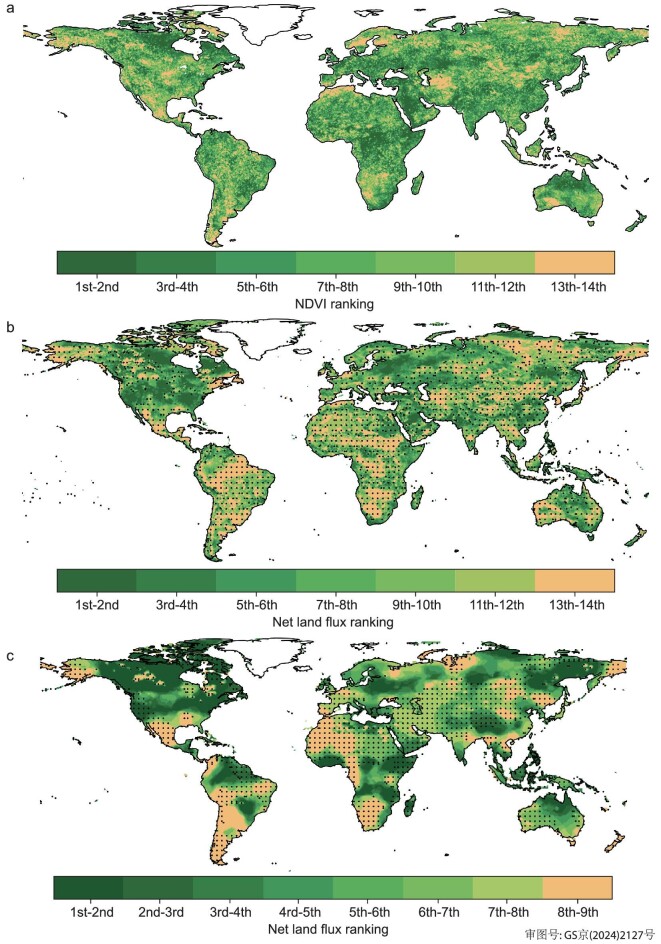
Figure 4.
(a) Ranks of the greenness index (NDVI from [43]) in each grid cell during 2010–2023 (rank 1 indicates the highest value among the 14 years). (b) Ranks of the bottom-up DGVM fluxes during the same period (rank 1 indicates the highest sink among the 14 years, rank 14 indicates the smallest sink or the largest source; to better appreciate whether a pixel of low rank is a source or remains a sink, each pixel that was an annual CO2 source in 2023 is stippled. (c) Ranks of the OCO-2 inversion fluxes during 2015–2023 (rank 1 indicates the highest sink among the 9 years, rank 9 indicates the smallest sink or the largest source).

