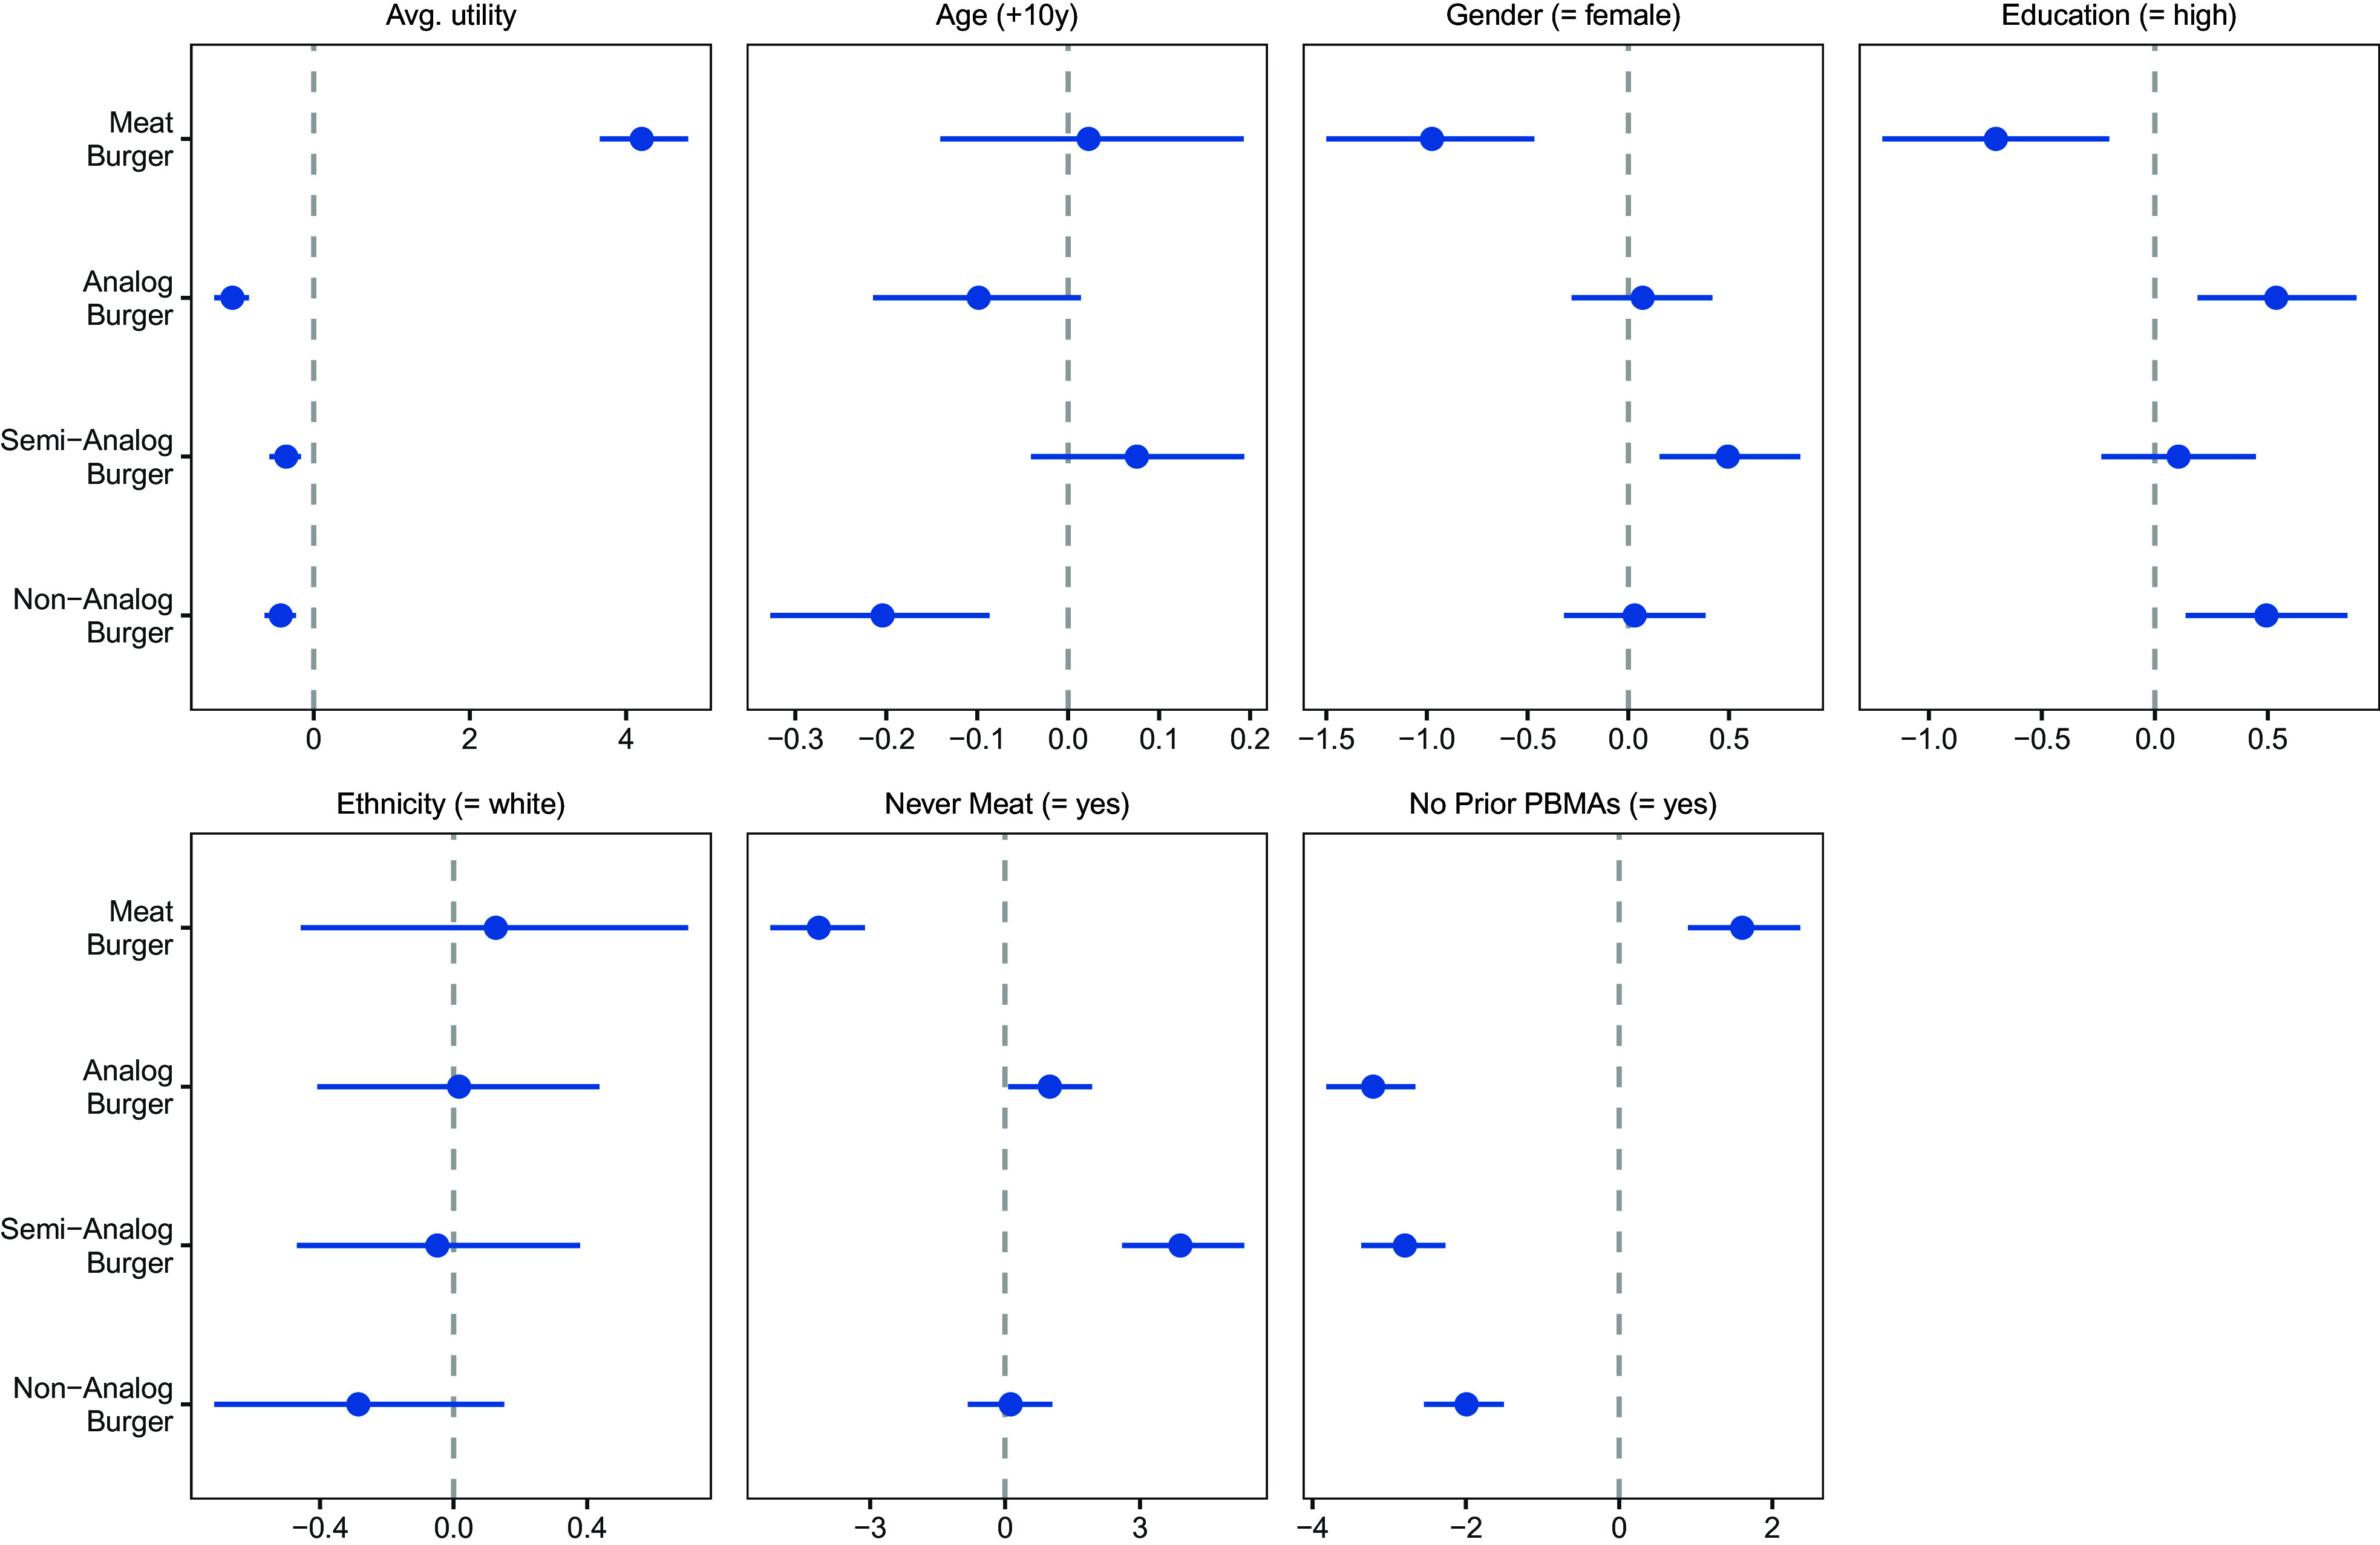
Fig. 1.

Exemplary Individual Differences in Burger Preference (Study 1). Note: The first box shows the average utility of each burger option that accounts for heterogeneity in preferences of the US population. The remaining boxes show observed heterogeneity as planned contrasts (posterior mean plus 95% credible intervals). Education = high: college degree or higher; Never Meat = yes: self-report to never eat meat; No Prior PBMAs = yes: self-report to never eat plant-based meat alternatives (PBMAs). For example, the meat burger has lower utility for females than males, whereas the semi-analog burger has higher utility for females. Numerical results are shown in SI Appendix, Table S2, Panel A.
