Figure 8.

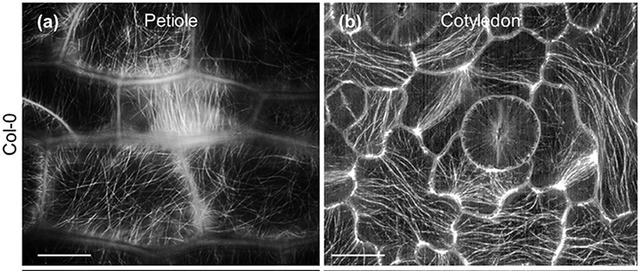
GFP‐TUBULIN A6–labeled Microtubules in A. thaliana petiole. (A) or cotyledon (B) cells imaged with SIM. Scale bar = 10 µm. Figure from (Komis et al., 2017). CC by license.

GFP‐TUBULIN A6–labeled Microtubules in A. thaliana petiole. (A) or cotyledon (B) cells imaged with SIM. Scale bar = 10 µm. Figure from (Komis et al., 2017). CC by license.