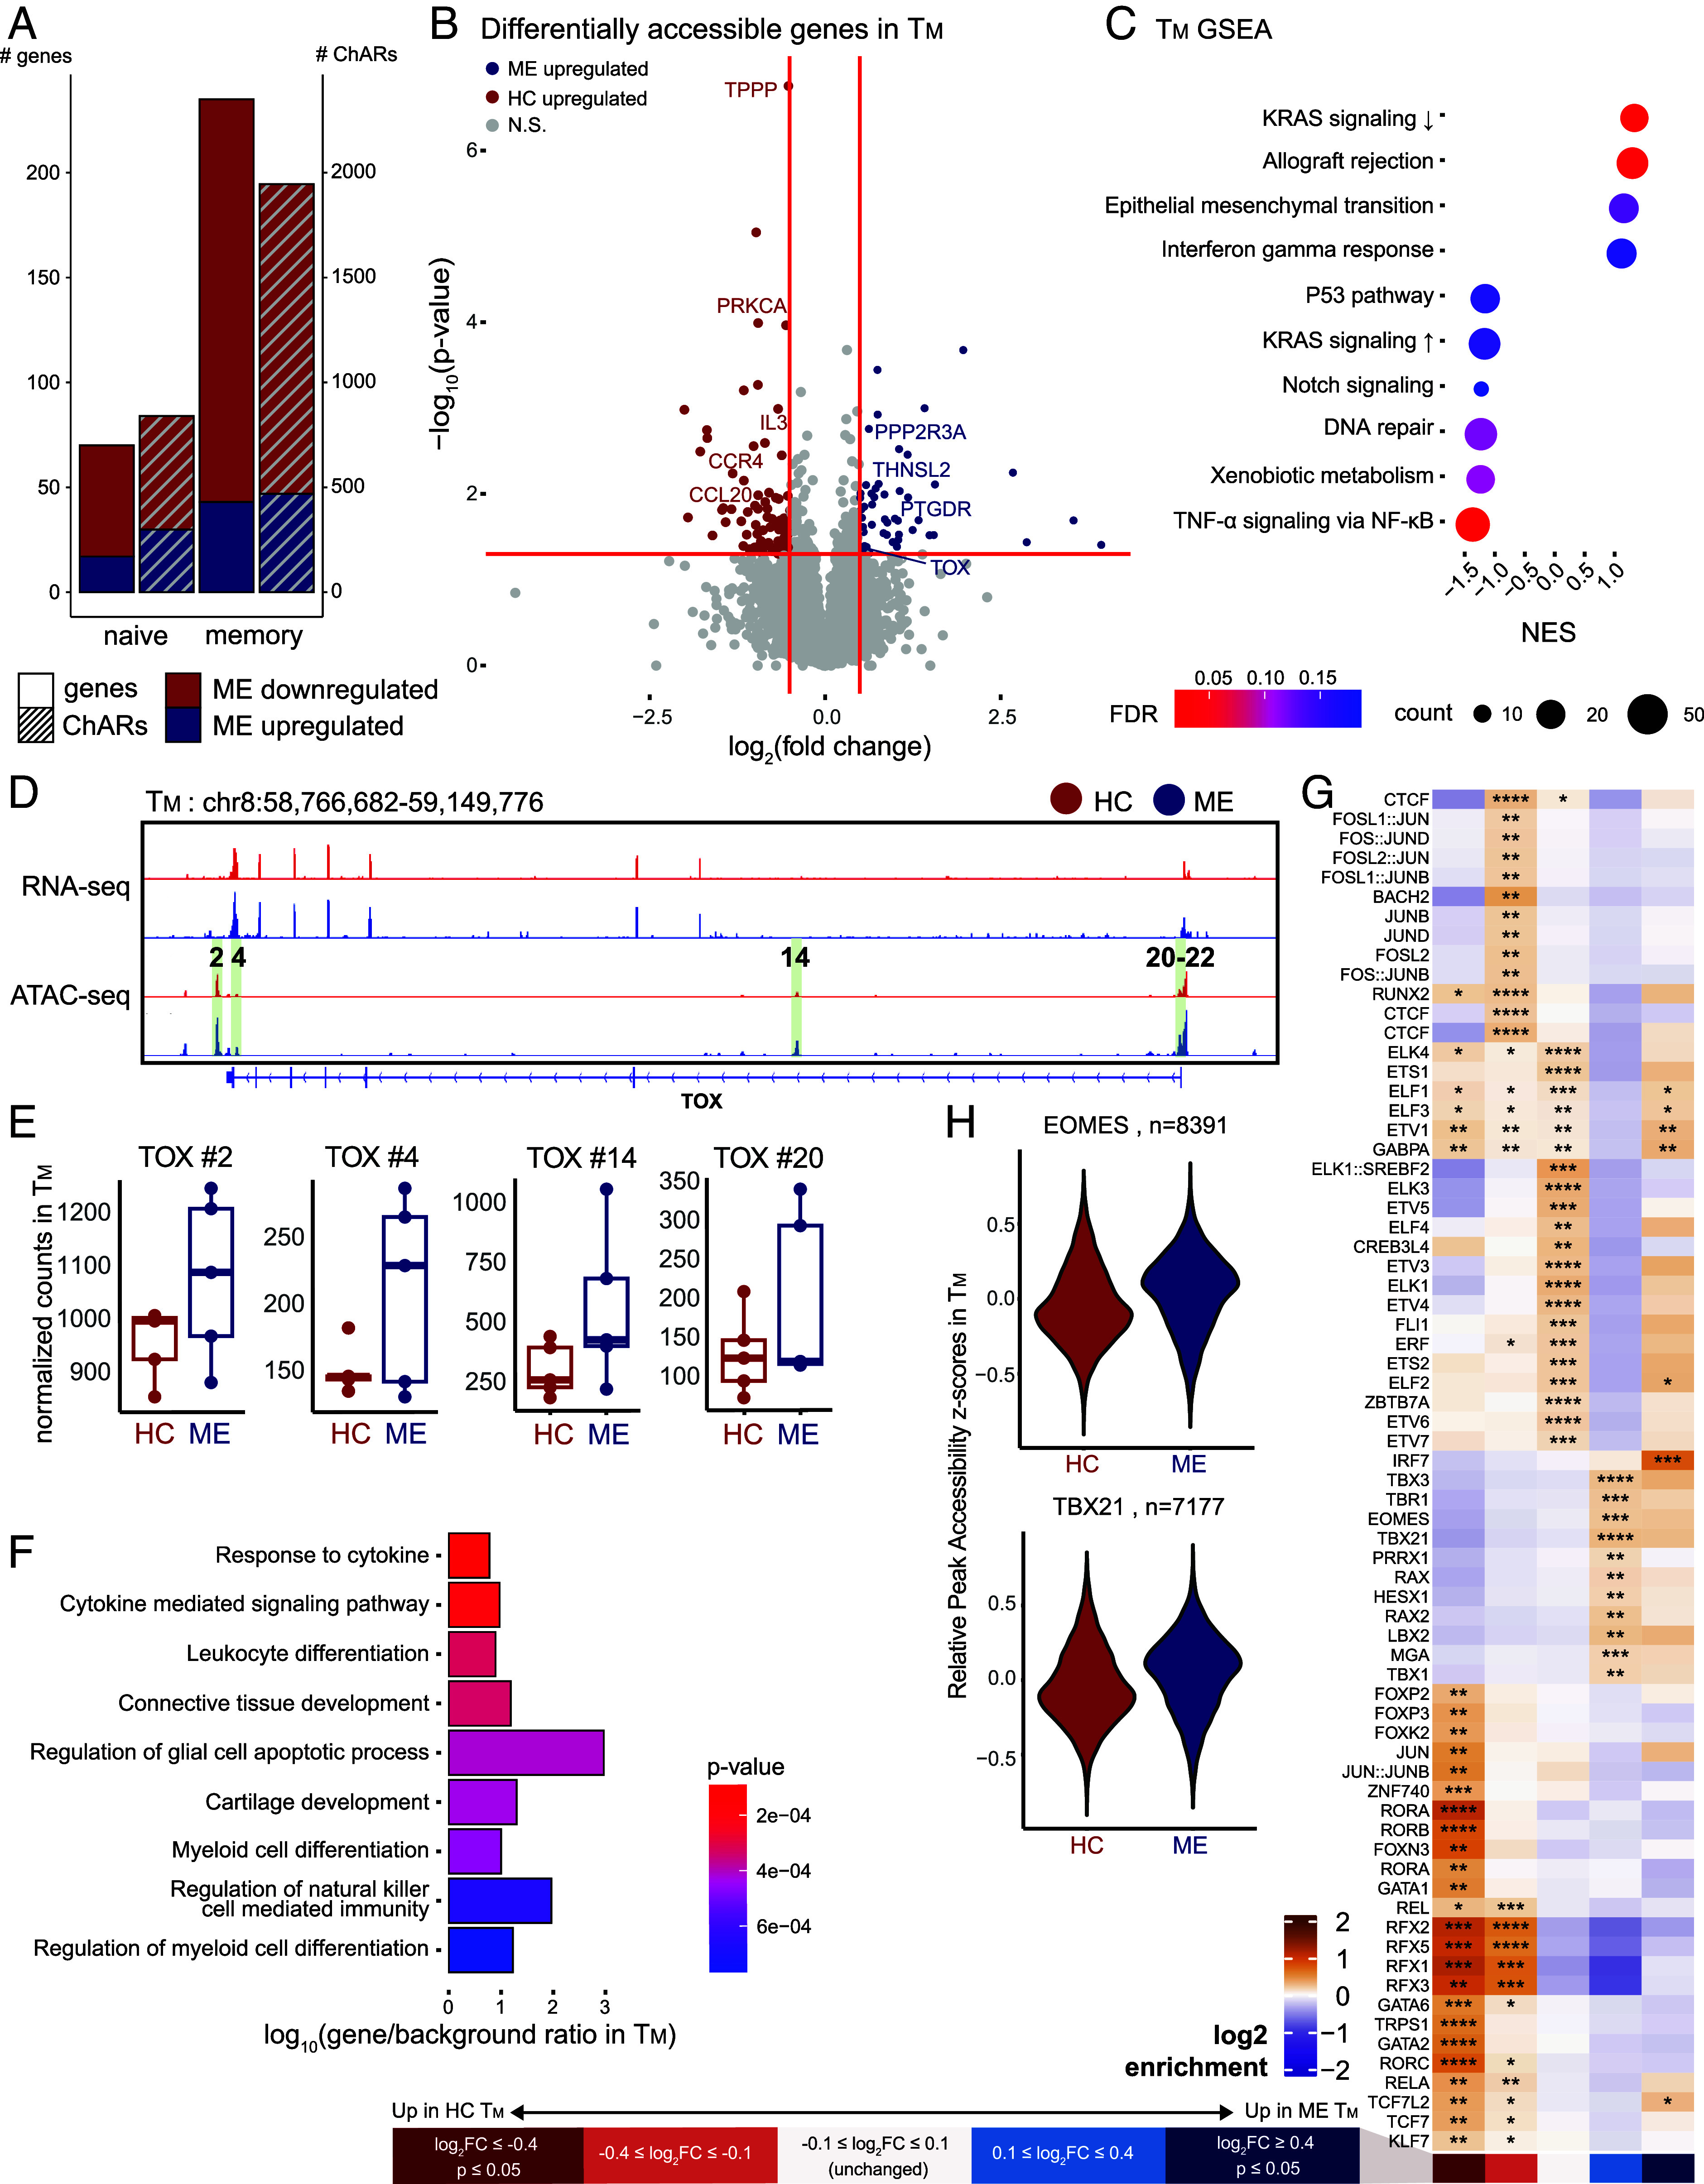
Fig. 3.

ME TM develop epigenetic signatures of exhaustion. (A) Bar plot of number of differentially accessible ChARs (right y-axis) and genes (left y-axis) per cell type, differentiating between down- and upregulated in ME (color). (B) Volcano plot highlighting differentially accessible genes identified by ATAC-seq in TM (P ≤ 0.05, colored dots, denoting direction of change as per panel A). (C) GSEA dot plot showing enrichment for hallmark pathway gene sets in TM. Dot size and color represent the number of core enrichment genes and log10 P-value, respectively. Positive NES values indicate enrichment in ME and vice versa. (D) Genome browser view of the TOX locus with RNA-seq and ATAC-seq tracks from TM. Numbered and highlighted regions denote relevant ChARs of interest. (E) Box plot of normalized counts at ChARs highlighted in panel (D), comparing between case and control. (F) Overrepresentation analysis of genes showing lower accessibility but no significant changes in expression level in ME TM against Gene Ontology: Biological Process pathways. Color indicates P-value and x-axis represents degree of enrichment (log10 gene-to-background ratio). (G) Heatmap of TF binding motifs significantly enriched in at least one bin of ChARs in TM. ChARs were grouped into five bins by differential accessibility in cases versus controls: significantly decreased (dark red), decreased (light red), unchanged (white), increased (light blue), and significantly increased (dark blue) accessibility in ME vs. controls. Color of each cell corresponds to log2 enrichment score of a motif in the respective bin, where positive values (orange) indicate enrichment and negative values (purple) indicate depletion. Significance of motif binding defined as q ≤ 0.0001. Enrichment scores normalized row-wise. (H) Distribution of peak accessibility z-scores in TM across peaks with at least one EOMES (Top) or T-BET (Bottom) motif.
