
Fig. 4.
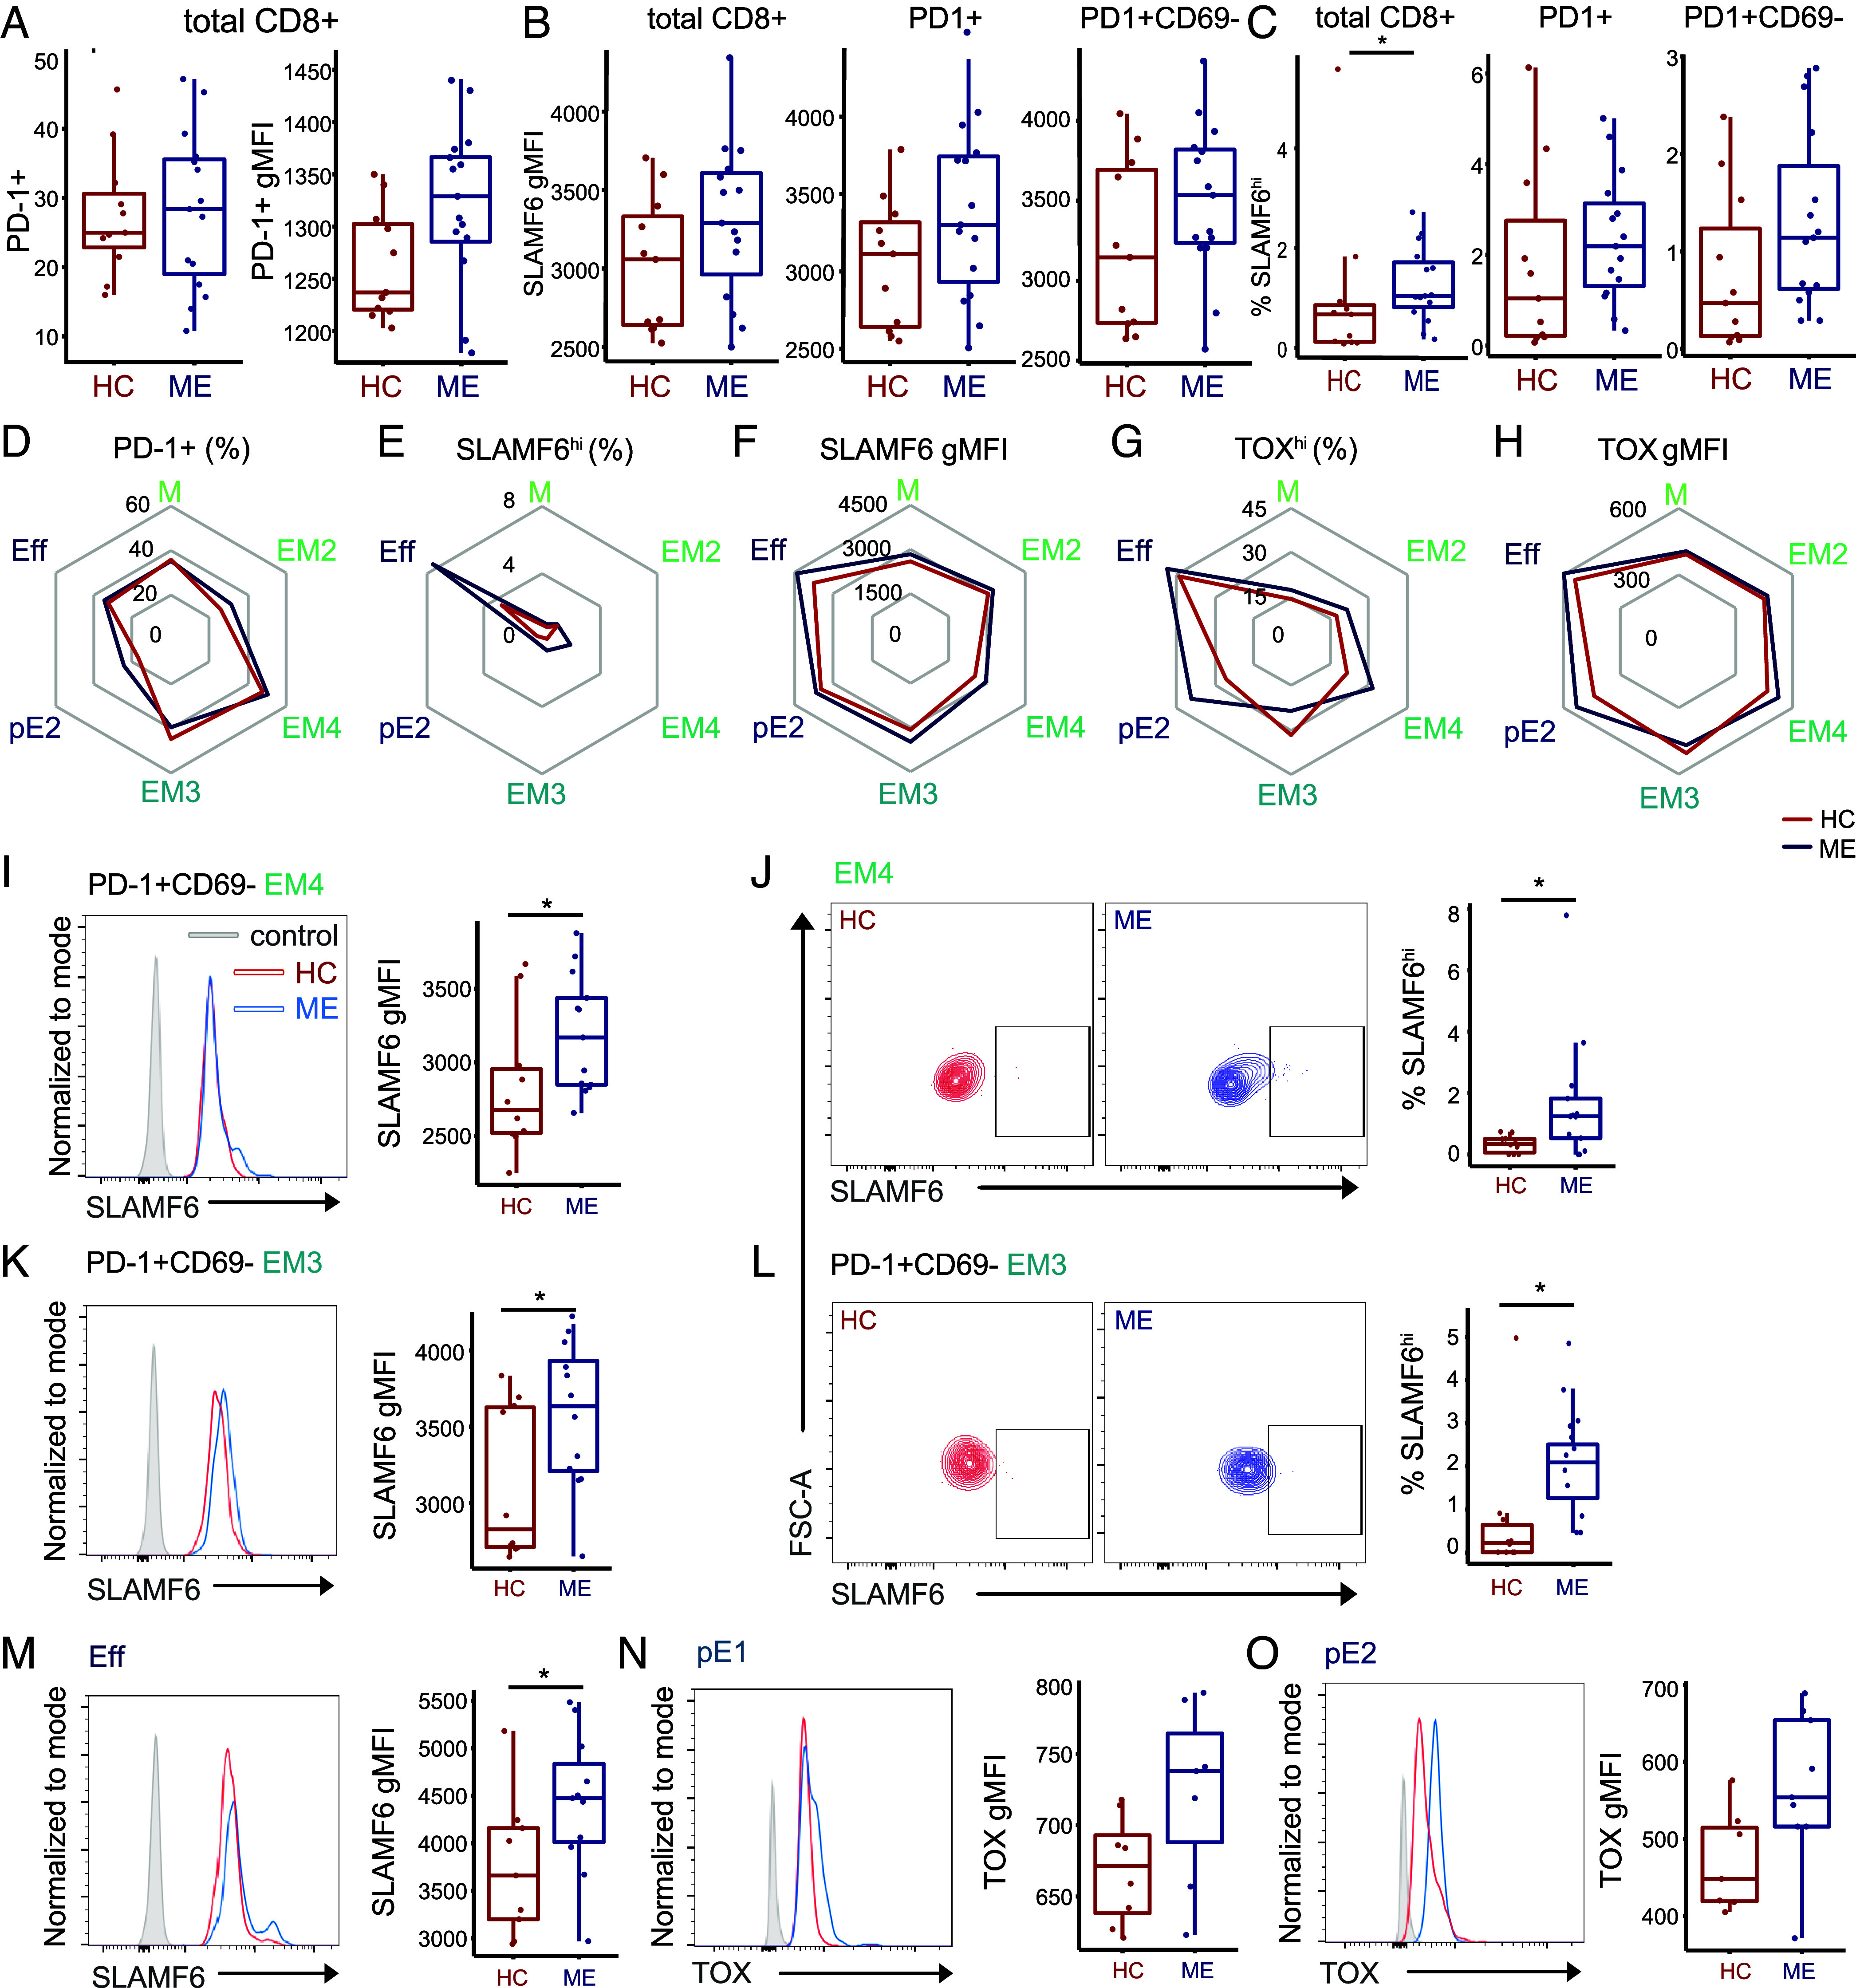
TOX and SLAMF6 are elevated in differentiated CD8+ T cell subsets. (A) Left: PD-1+ frequency (P = 0.92) in total CD8+ T cells. Right: gMFI expression levels of PD-1 (P = 0.055) in CD8+ T cells, compared between HC and ME. gMFI = geometric mean fluorescence intensity, FMO = fluorescent minus one negative control. (B) SLAMF6 expression levels in total CD8+ (P = 0.14), CD8+PD-1+ (P = 0.16), and CD8+PD-1+CD69− (P = 0.16) T cell subsets, compared between HC and ME. (C) SLAMF6hi frequencies in total CD8+ (P = 0.04), CD8+PD-1+ (P = 0.15), and CD69-SLAMF6hi frequency in CD8+PD-1+ (P = 0.055) T cell subsets, compared between HC and ME. (D) Spider plots of T cell subsets depicting PD-1+ frequency, (E) SLAMF6hi frequency, (F) SLAMF6 gMFI, (G) TOXhi frequency, and (H) TOX gMFI between HC and ME. Each red (HC) or blue (ME) line represents the mean percentage or gMFI per T cell subset (y axis). (I) Representative scatter plots of SLAMF6hi populations in EM4 T cells, and box plot of SLAMF6hi frequency in EM4 T cells (P = 0.02, n = 10/13), compared between HC and ME. (J) Representative histogram and box plot of SLAMF6 expression in PD-1+CD69− EM4 T cells (P = 0.049, n = 10/13), compared between HC and ME. (K) Representative scatter plots of SLAMF6hi populations in PD-1+CD69− EM3 T cells, and box plot of SLAMF6hi frequency in EM3 T cells (P = 0.036, n = 10/12), compared between HC and ME. (L) Representative histogram and box plot of SLAMF6 expression in PD-1+ CD69− EM3 T cells (P = 0.05, n = 10/12), compared between HC and ME. (M) Representative histogram and box plot of SLAMF6 expression in Eff (P = 0.046, n = 9/11), compared between HC and ME. (N) TOX expression levels in pE1 (P = 0.072, n = 7/7), and of (O) TOX expression in pE2 (P = 0.057, n = 7/9), compared between HC and ME.