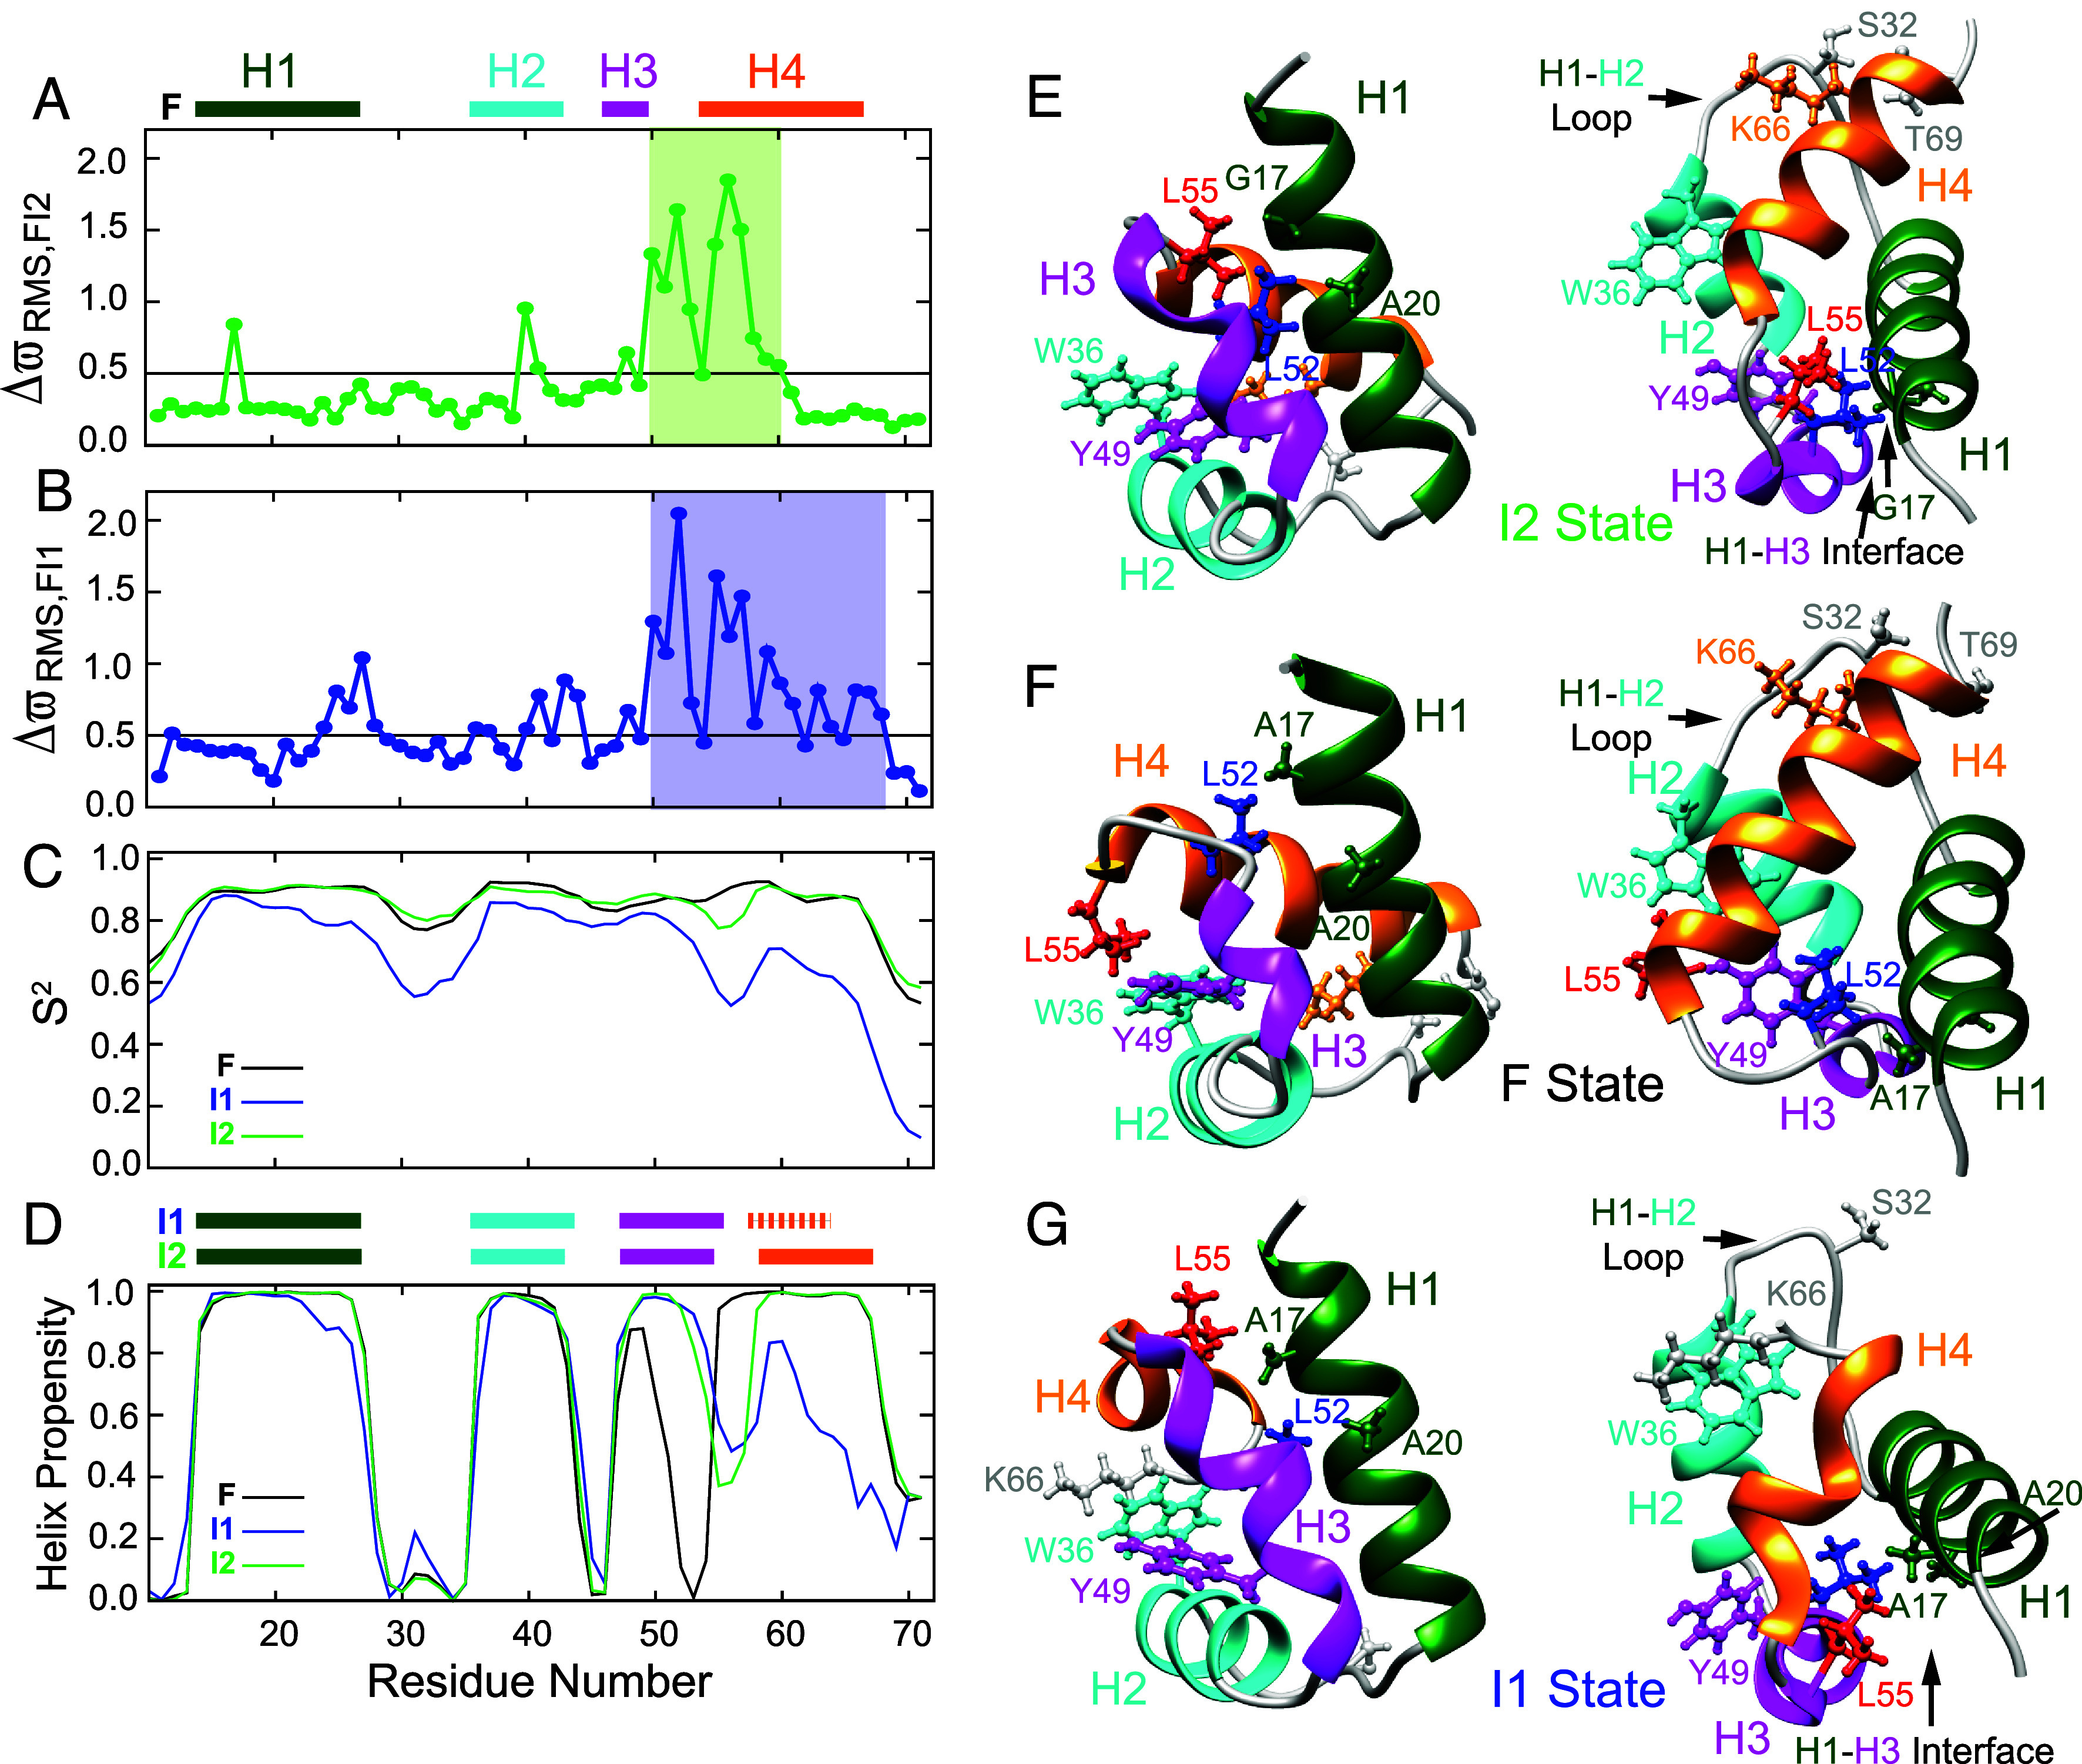
Fig. 3.

Insights into the structure and dynamics of the I2 state from CEST derived chemicals shifts. Plots of (A) and (B) as a function of residue. Here, is calculated for each residue. The summation over i extends over all the backbone nuclei (15N, 1HN, 1Hα, 13Cα, 13CO) and sidechain 13Cβ carbons in the residue for which the values are available, is the SD in reported chemical shifts (51) for nucleus i. In (A) and (B) the horizontal black line is drawn at = 0.5 ppm. values (A) are from the CEST experiments performed in this study, while values (B) were obtained previously using CPMG experiments (3). (C and D) Residue specific S2/helix propensity values estimated using TALOS-N from the chemical shifts of the F state (black), CEST derived chemical shifts of the I2 state (green), and CPMG derived chemical shifts of the I1 state (blue). Helix boundaries obtained using TALOS-N are shown for the F state above panel A (H1 (K14–E27), H2 (W36–I43), H3 (P47–S50), and H4 (L55–Q68)) and for the I2/I1 states above panel (D). Helix boundaries in the I2 state are H1 (K14–E27), H2 (W36–I43), H3 (P47–K54), and H4 (K58–Q68) and in the I1 state: H1 (K14–E27), H2 (W36–I44), H3 (P47–L55), and H4 (E57–A64). Two views (orientations) of the A17G FF CEST derived I2 state (E), WT FF F state (F) [PDB: 1UZC] (33), and WT FF CPMG derived I1 state [PDB: 2KZG] (3) (G) structures with key residues shown using the ball and stick representation. In (E-G) L55 is colored in red and L52 is colored in blue. All other residues have the same color as the helix in which they are situated or are in gray if they are in loops. Residues from N12 to E70 are shown in the I2 and F state structures (E and F) while residues from N12 to K66 are shown in the I1 state structure (G). In (E–G) only the lowest energy structure is displayed.
