
Fig. 5.
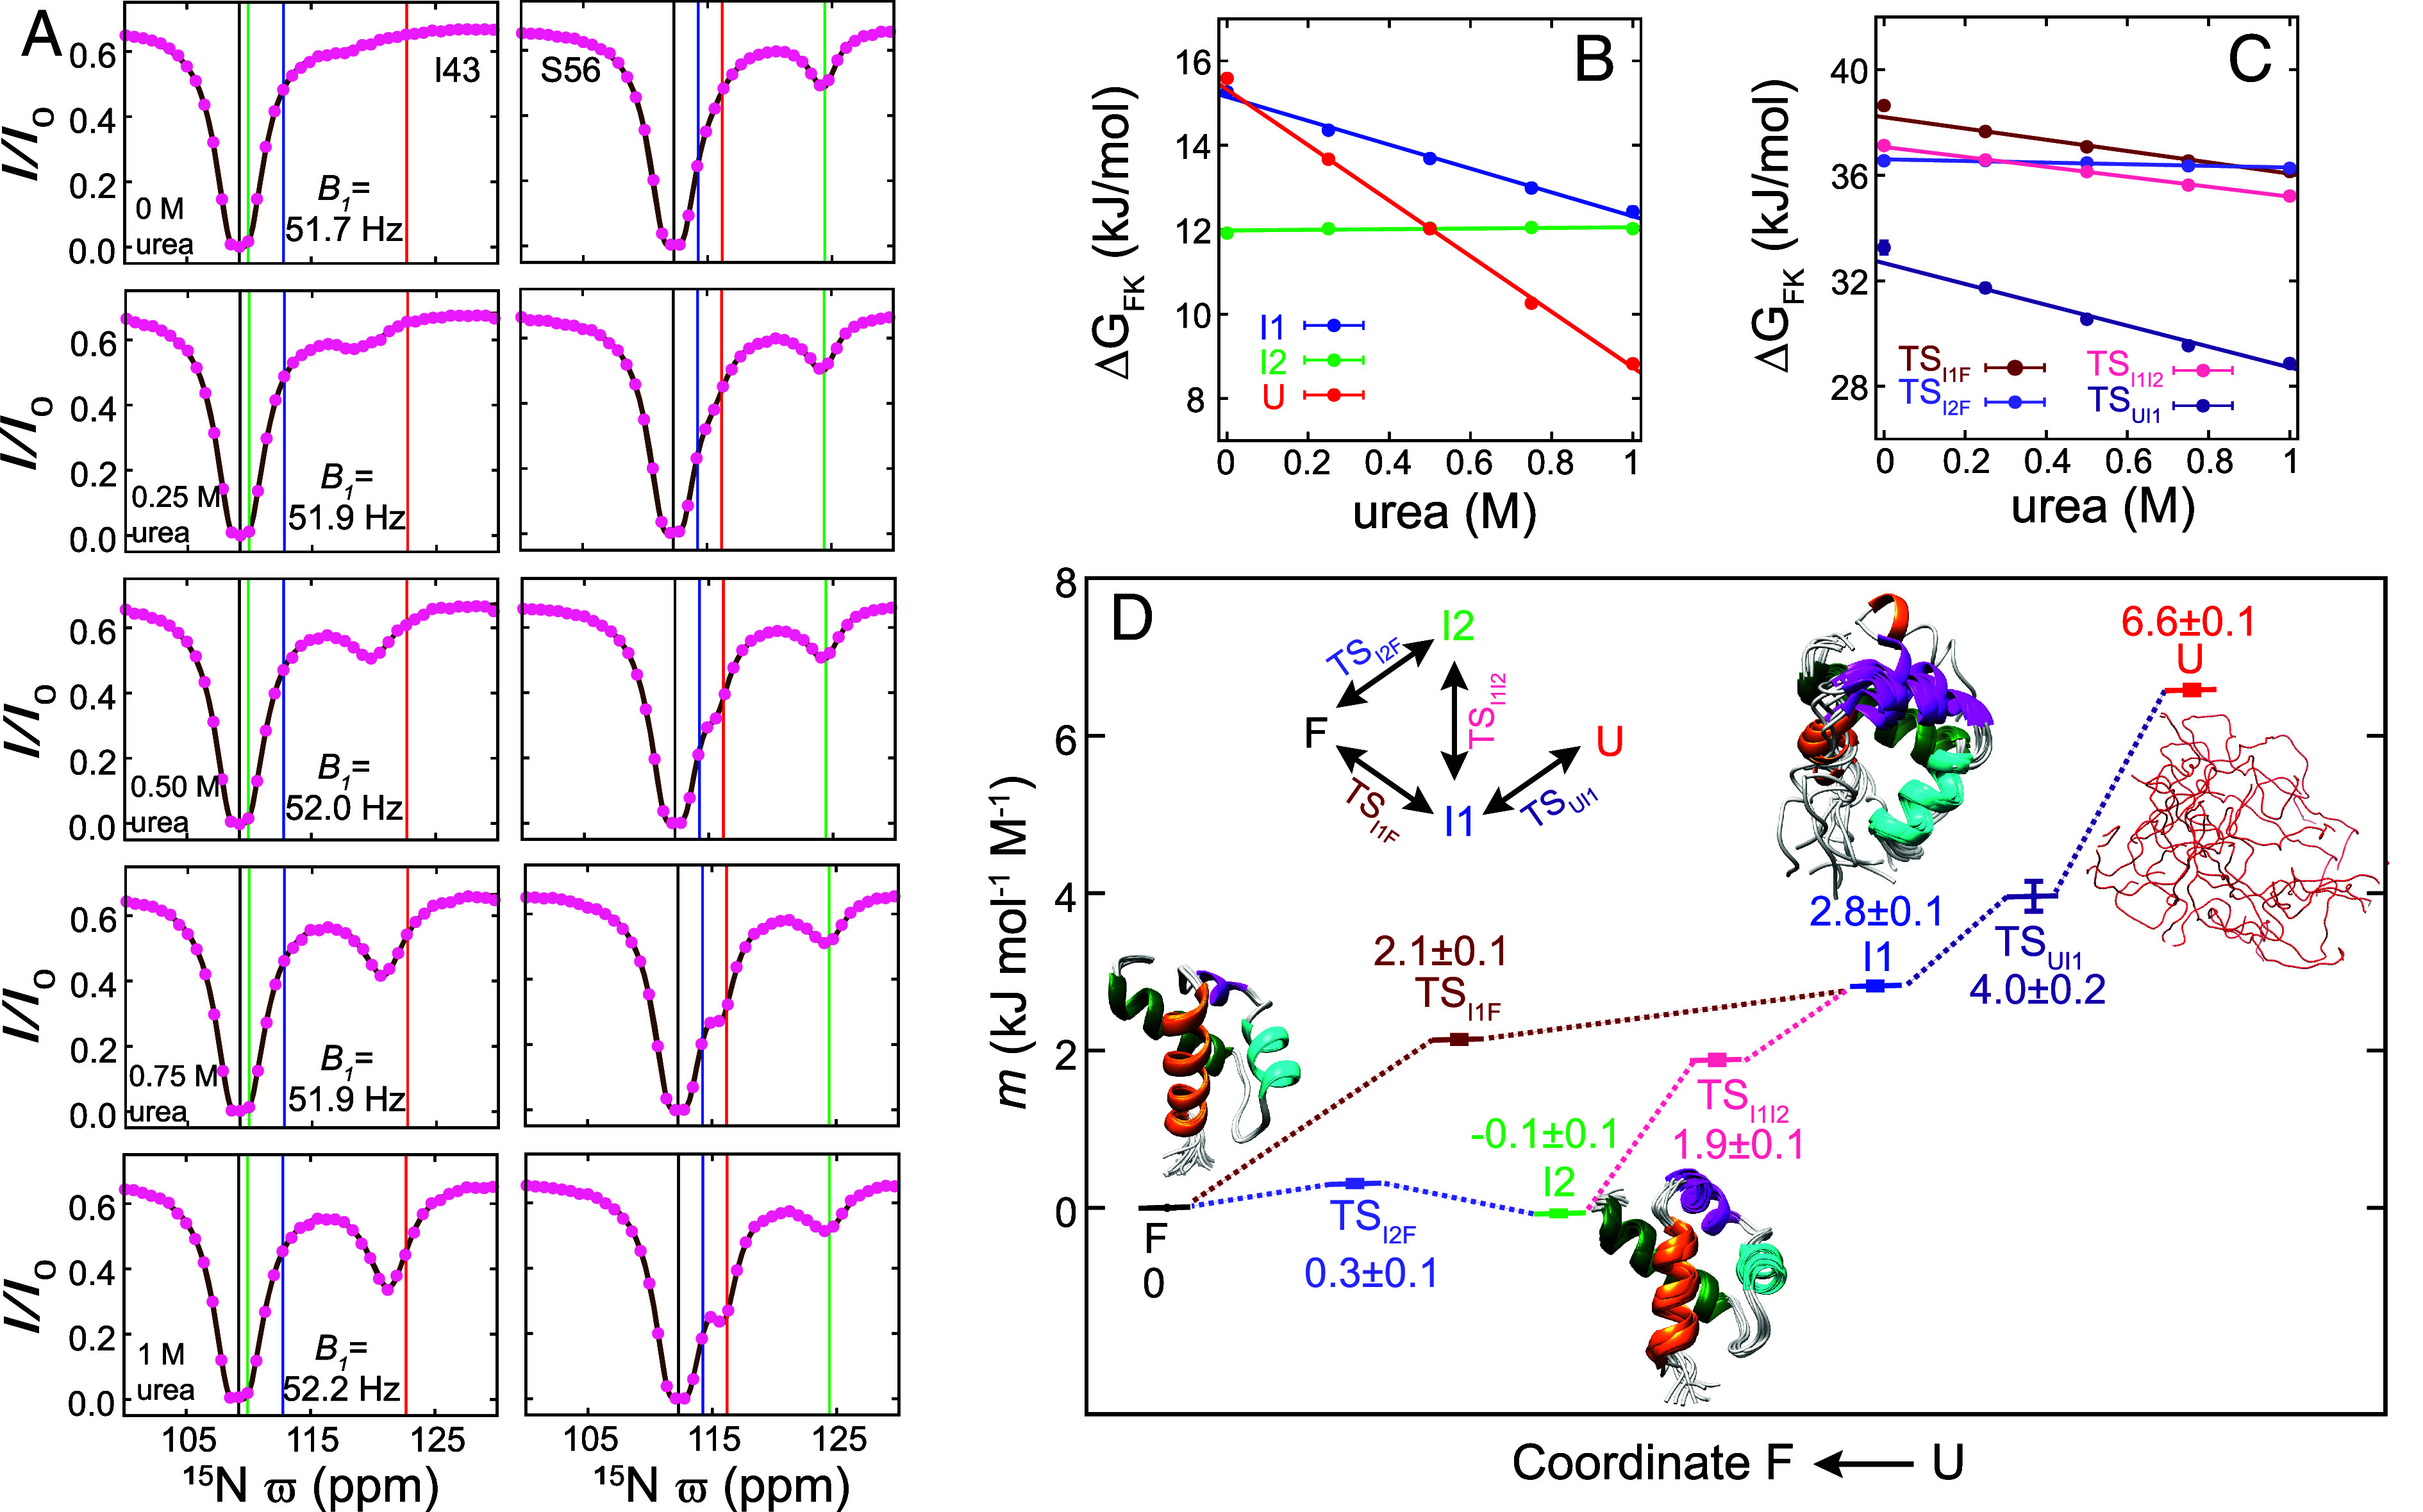
m-values describe how the compaction of A17G FF evolves along the folding trajectory. (A) Representative amide 15N CEST profiles from I43 and S56 in A17G FF (16.4 T; TEX = 400 ms; 2.5 °C) recorded with varying amounts of urea. Experimental data are shown with pink circles while the continuous brown line in each panel is calculated from the best-fit parameters. The vertical black, blue, green, and red lines correspond to the fitted , , , and values, respectively. (B) Variation of , , and as a function of urea concentration. The m-value for state K (mK) is obtained from the slope of the urea concentration dependence of , with and obtained from the analysis of the amide 15N CEST profiles recorded at different urea concentrations, as illustrated in (A). (C) Variation of , , , and as a function of urea concentration, where is the free energy difference between TSKJ and the F state. The m-value for transition state TSKL (mTSKL) is obtained from the slope of the urea concentration dependence of , where , and are derived from the analysis of 15N CEST profiles recorded as a function of urea concentration. The constant C is set to be s−1 and does not affect the value of mTSKL. Best-fit four-state exchange parameters obtained at various urea concentrations are listed in SI Appendix, Table S4. (D) Urea m-values obtained from (B) and (C) at various points along the folding landscape of A17G FF. Ten structures (W11–K71) of the F state (WT FF), the I1 state (WT FF), and the I2 state (A17G FF) are shown. In the case of the I1 state, residues corresponding to the disordered H4 helix have been added for the purpose of illustration.