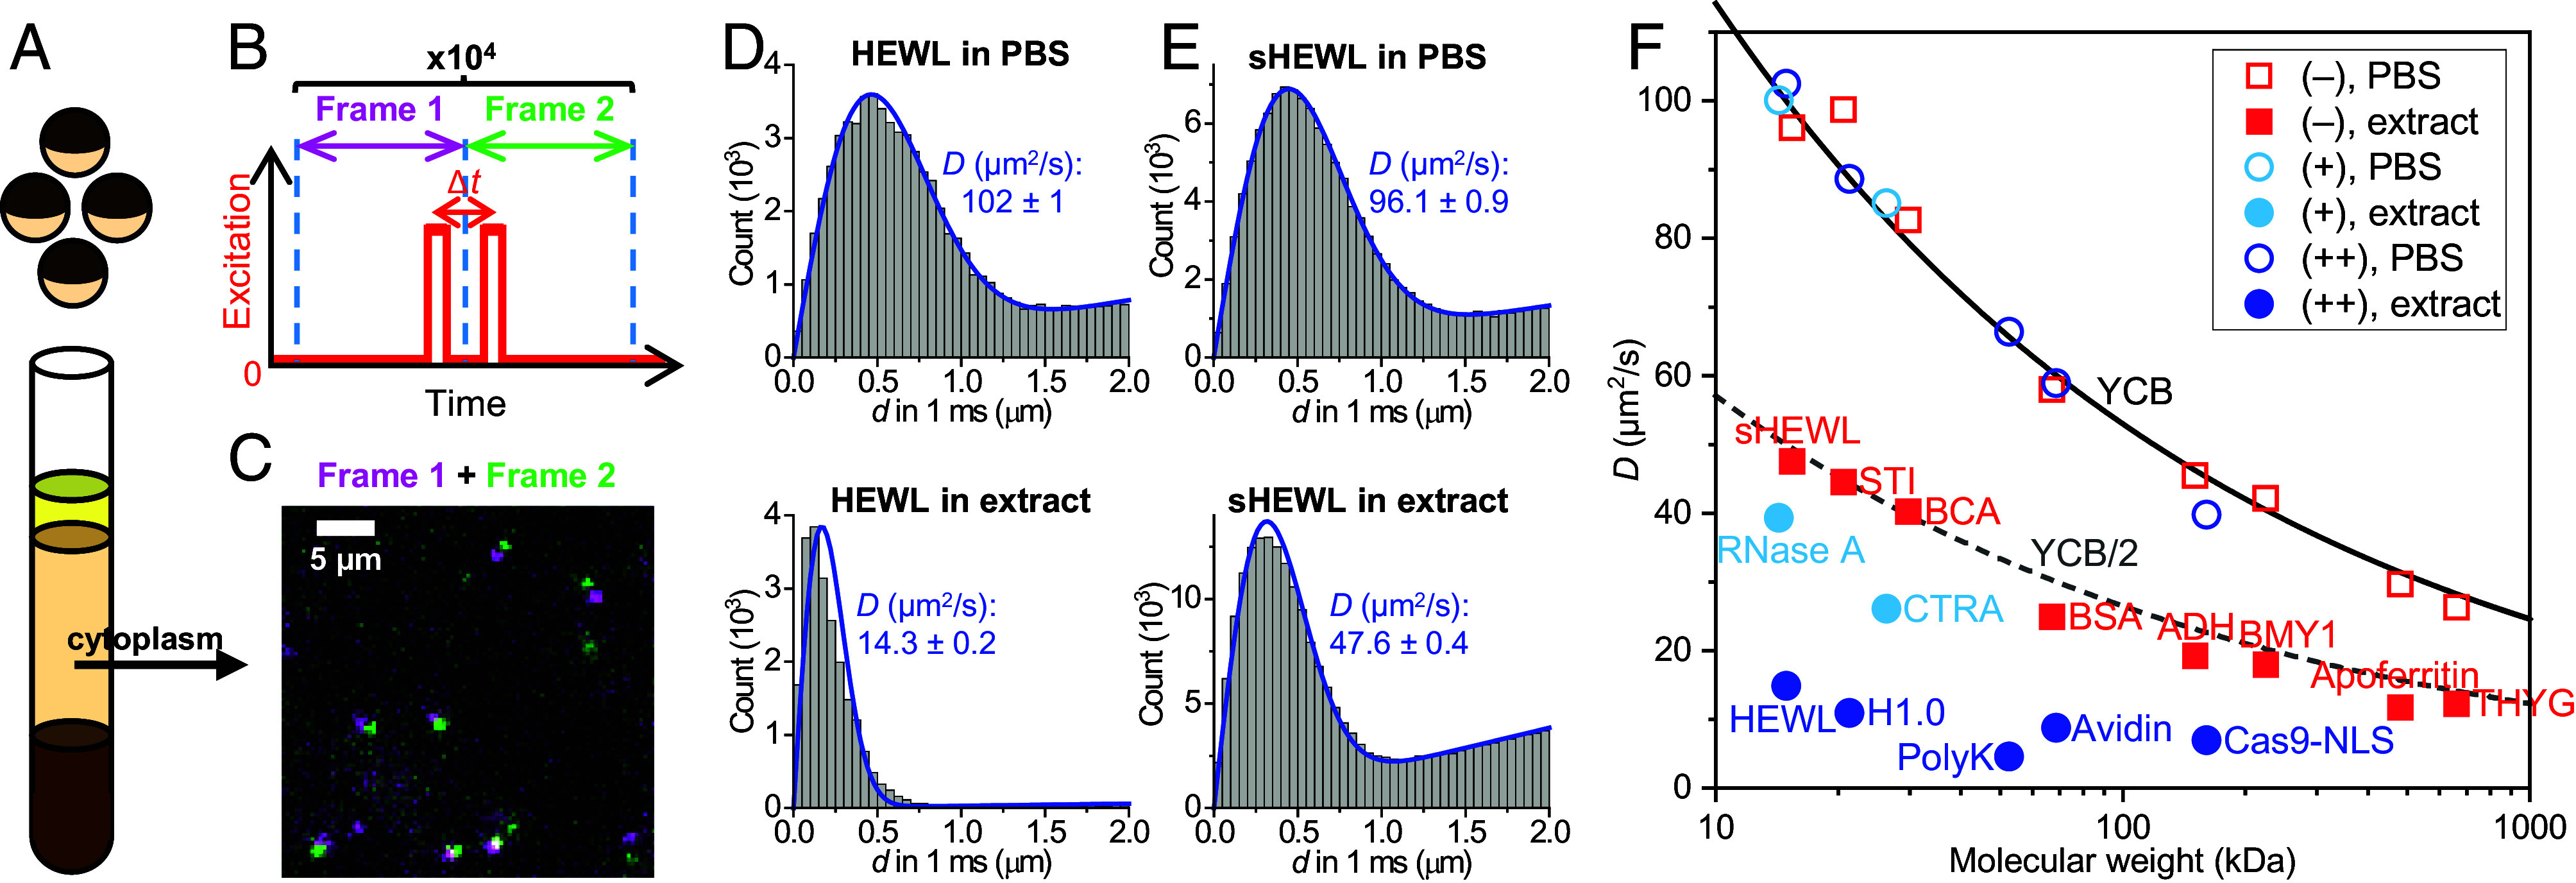
Fig. 1.

SMdM-based protein diffusivity quantification in Xenopus egg extract versus in PBS. (A) Schematic: Cytoplasmic extracts from Xenopus eggs. (B) Schematic: In SMdM, paired excitation pulses are repeatedly applied across tandem camera frames, so that transient single-molecule displacements are captured in the wide field for the time window defined by the separation between the paired pulses, Δt. (C) Example single-molecule images of Cy3B-labeled bovine carbonic anhydrase diffusing in the extract, shown as a magenta-green overlaid image for a tandem pair of frames at Δt = 1 ms. (D) Example distributions of SMdM-recorded 1-ms single-molecule displacements for ~200 pM Cy3B-labeled HEWL diffusing in PBS (Top) versus in extract (Bottom). Blue curves: fits to our single-mode diffusion model, with resultant apparent diffusion coefficients D and 95% CI marked in each plot. (E) Similar to (D), but for succinylated HEWL (sHEWL). (F) SMdM-determined D values for 15 proteins of varied sizes and charges (SI Appendix, Table S1), in PBS (hollow symbols) and extract (filled symbols). Red squares: Negatively charged proteins. Blue circles: Positively charged proteins with >+5 net charges. Light-blue circles: Weakly positively charged proteins with ~+2 net charges. Each data point is an average of at least three SMdM measurements from two or more extract samples. Solid curve: Expected D in PBS at room temperature according to the Young−Carroad−Bell (YCB) model. Dashed curve: The PBS YCB values divided by 2.
