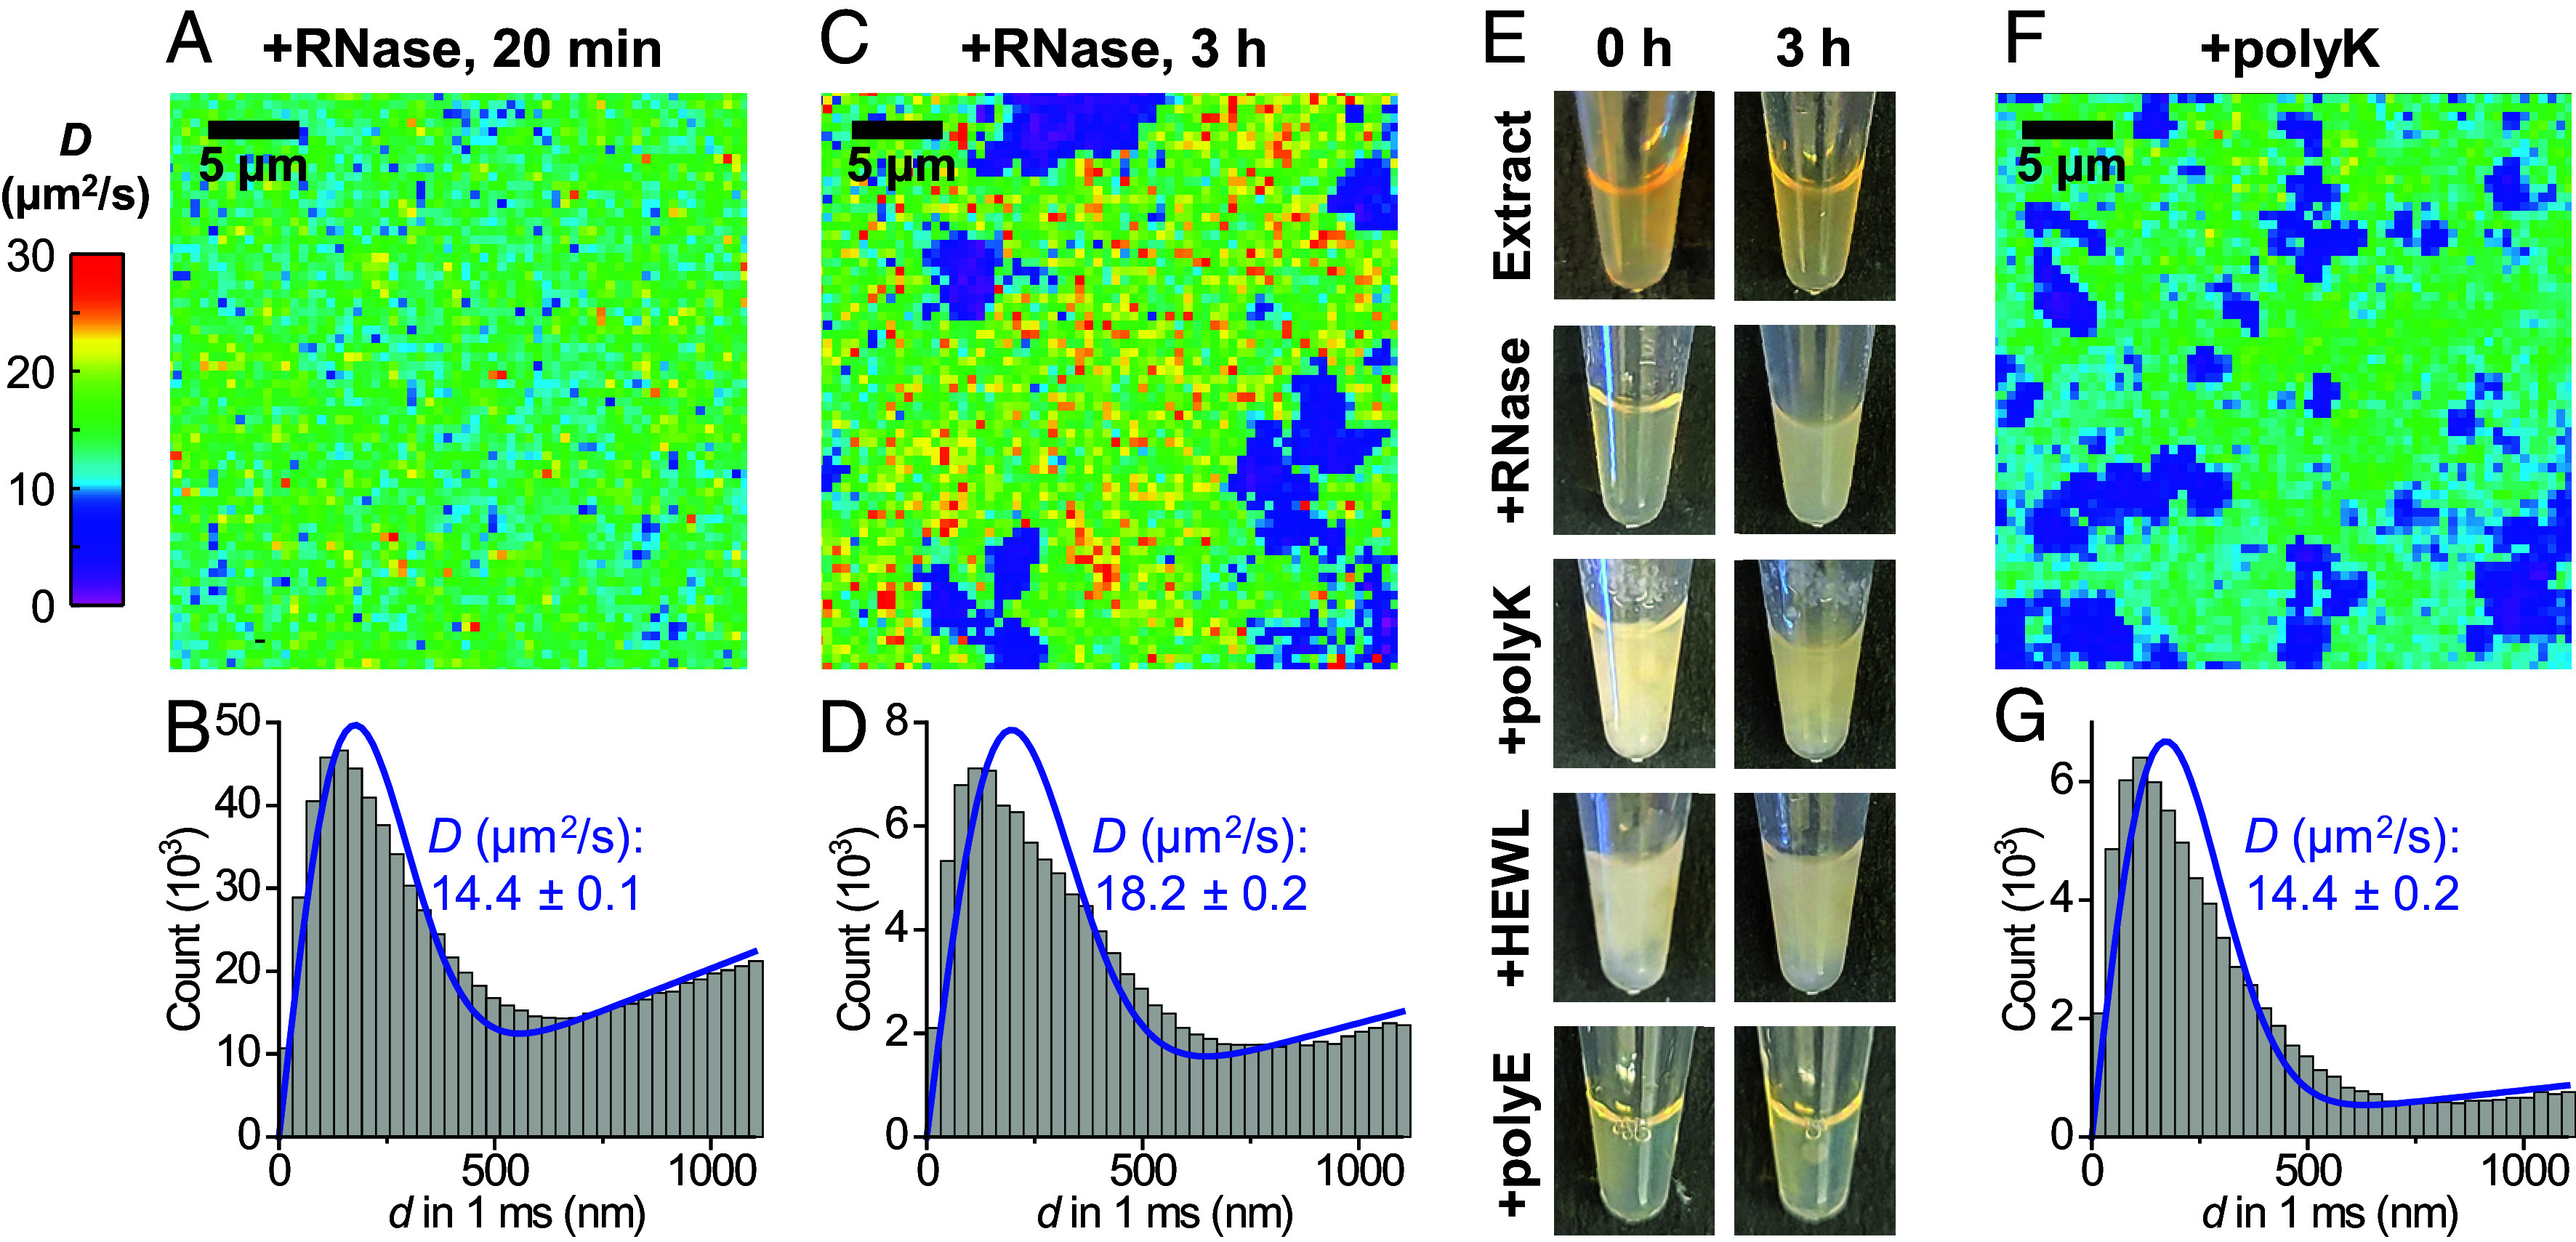
Fig. 3.

SMdM diffusivity mapping of HEWL in RNase-treated egg extracts further underscores the charge-sign asymmetry of the cytoplasmic environment. (A) Color-coded SMdM diffusivity map of Cy3B-labeled HEWL in an extract sample 20 min after RNase A treatment at room temperature. (B) Distributions of single-molecule displacements for the data in (A). Blue line: fit to the SMdM diffusion model, with resultant apparent diffusion coefficient D and 95% CI noted. (C) SMdM diffusivity map of the same sample after 3 h. (D) Distributions of single-molecule displacements for regions outside the low-diffusivity domains in (C). (E) Photos of extract samples taken immediately (Left) and after 3 h (Right), after RNase A treatment or the addition of 1 mg/mL polylysine, HEWL, or polyglutamic acid. (F) Color-coded SMdM D map of Cy3B-labeled HEWL in an extract sample supplemented with 1 mg/mL polylysine. (G) Distribution of single-molecule displacements for regions outside the low-diffusivity domains in (F).
