. 2024 Dec 13;12:RP90419. doi: 10.7554/eLife.90419

Figure 5. Loss of Slc39a5 results in elevated hepatic zinc and activation of hepatic AMPK signaling in leptin-receptor deficient female mice and female mice challenged with high-fat high fructose diet (HFFD).

Analyses were done on explanted liver samples collected after 16 hr of fasting at an endpoint in Lepr-/- (A–C) and HFFD mice (D–F). (A, D) Immunoblot analysis of hepatic AMPK and AKT activation. AMPK and AKT signaling is activated in Lepr-/-; Slc39a5-/- mice and HFFD Slc39a5-/- mice (compared to their Scl39a5+/+ counterparts). (B, E) Hepatic zinc is elevated in Lepr-/-; Slc39a5-/- mice and HFFD Slc39a5-/- mice (n=10–21). (C, F) Elevated hepatic zinc results in increased Mt1 (zinc responsive gene) expression in both models. (G) Immunoblot analysis of primary human hepatocytes treated with zinc chloride (ZnCl2), and magnesium chloride (MgCl2), okadaic acid (OA), metformin (Met) for 4 hr. Zinc-activated AMPK and AKT signaling in primary human hepatocytes. (H) Densitometric analysis of immunoblots (compared to control). *p<0.05, **p<0.01, ***p<0.001, ANOVA with post hoc Tukey’s test.

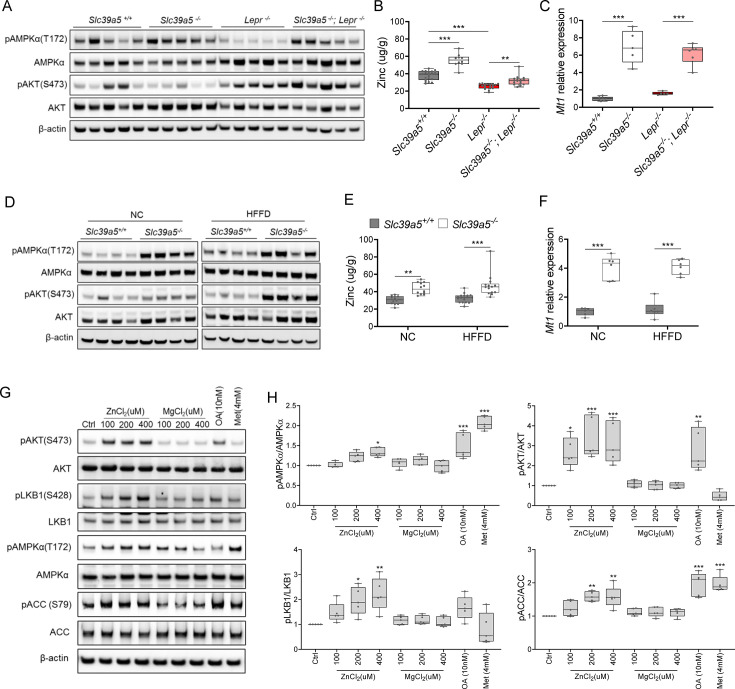
Figure 5—source data 1. Original files of the full raw uncropped, unedited blots.
Figure 5—source data 2. Figures with the uncropped blots with the relevant bands clearly labeled.

Figure 5.

Figure 5—figure supplement 1. Loss of Slc39a5 results in elevated hepatic zinc and activation of hepatic AMPK signaling in congenital and diet-induced obesity models.

Figure 5—figure supplement 1.

Analyses were done on explanted liver samples collected from male mice after 16 hr of fasting at an endpoint of congenital (A–C) and diet-induced obesity (D–F). (A, D) Immunoblot analysis of hepatic AMPK and AKT activation. (B, E) Hepatic zinc measurements (n=10–21). (C, F) Hepatic Mt1 gene expression. *p<0.05, **p<0.01, ***p<0.001, ANOVA with post hoc Tukey’s test.
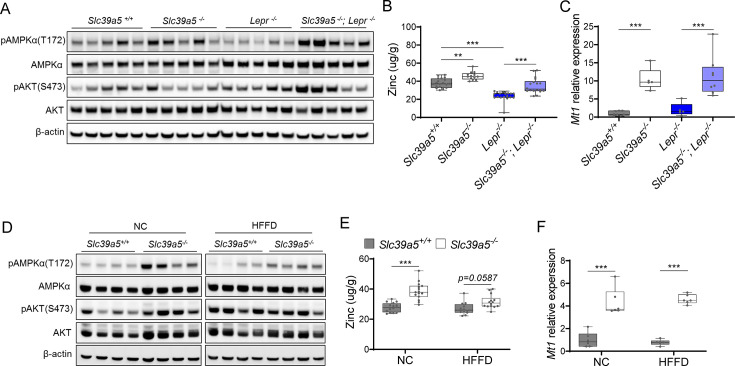
Figure 5—figure supplement 1—source data 1. Original files of the full raw uncropped, unedited blots.
Figure 5—figure supplement 1—source data 2. Figures with the uncropped blots with the relevant bands clearly labeled.
Figure 5—figure supplement 2. Loss of Slc39a5 does not alter hepatic magnesium, iron, copper, calcium, and cobalt levels in Lepr-/- mice.

Figure 5—figure supplement 2.

Female (A–C) and male (D–F) mice were examined at 34 wk of age. (A, D) Densitometric analysis of hepatic AMPK and AKT signaling. (B, E) Hepatic expression of Slc39a5 and Mt2. (C, F) Hepatic ion quantification by flame atomic absorption spectrometry. *p<0.05, **p<0.01, ***p<0.001, ANOVA with post hoc Tukey’s test.
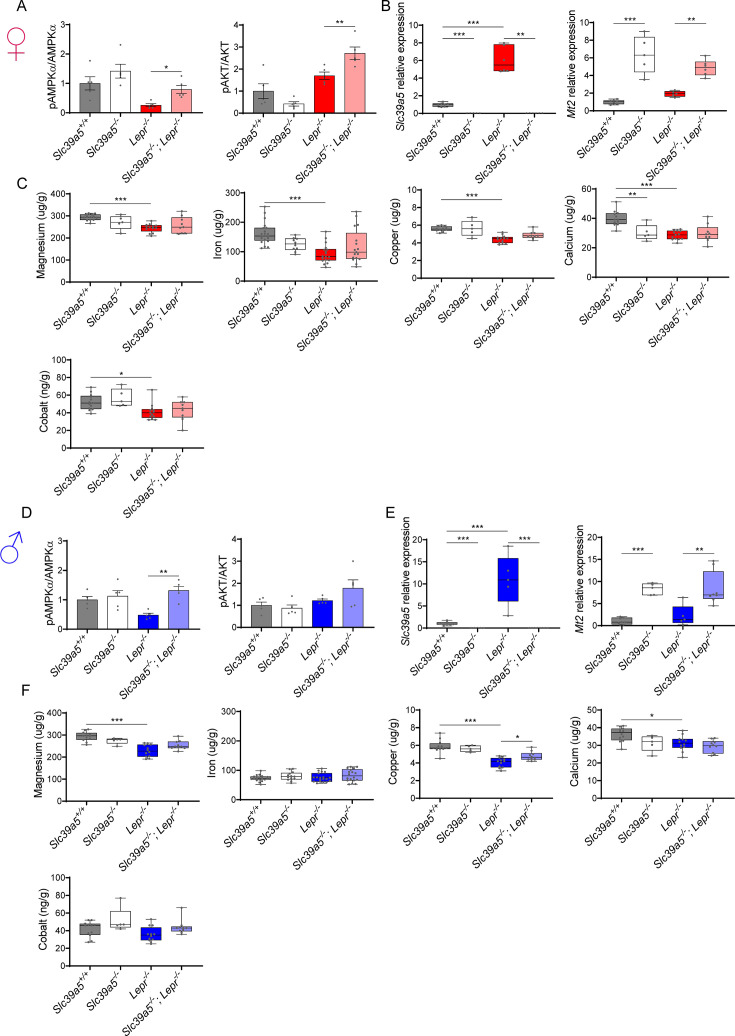
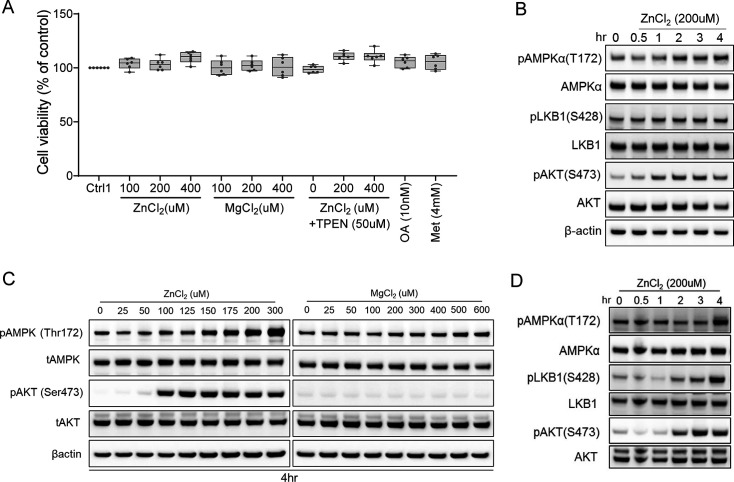
Figure 5—figure supplement 3. Zinc activates AMPK and AKT signaling in a time-dependent and dose-dependent manner.

Figure 5—figure supplement 3.

(A) No differences in cell viability were observed in human primary hepatocytes (after 4 hr treatment) across different experimental groups. (B) Time-resolved (0–4 hr) immunoblotting analyses of primary human hepatocytes treated with zinc chloride. (C) Immunoblots of HepG2 were treated with zinc chloride (ZnCl2) and magnesium chloride (MgCl2). (D) Time-resolved (0–4 hr) immunoblotting analyses of HepG2 treated with zinc chloride. Okadaic acid (OA), metformin (Met), N,N,N',N'-Tetrakis(2-pyridylmethyl)ethylenediamine (TPEN).
Figure 5—figure supplement 3—source data 1. Original files of the full raw uncropped, unedited blots.
Figure 5—figure supplement 3—source data 2. Figures with the uncropped blots with the relevant bands clearly labeled.
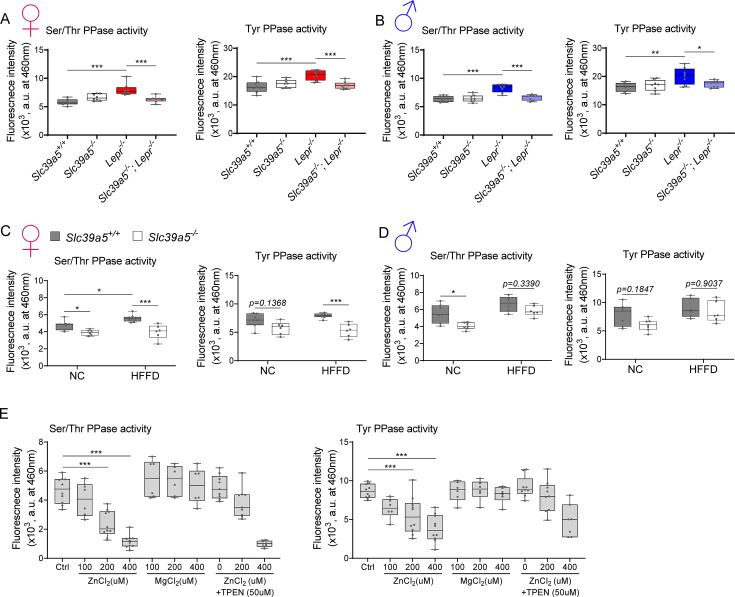
Figure 5—figure supplement 4. Elevated hepatic zinc results in reduced protein phosphatase activity.

Figure 5—figure supplement 4.

Analyses were done on explanted liver samples collected after 16 hr fast at the endpoint of congenital obesity (A–B) and diet-induced obesity (C–D) challenges. Female (A, C) and Male (B, D) mice. (A–D) Ser/Thr and Tyr protein phosphatase activity. (E) Ser/Thr and Tyr protein phosphatase activity in primary human hepatocytes treated with zinc chloride (ZnCl2), magnesium chloride (MgCl2), and N,N,N',N'-Tetrakis(2-pyridylmethyl)ethylenediamine (TPEN) for 4 hr. *p<0.05, **p<0.01, ***p<0.001, ANOVA with post hoc Tukey’s test.