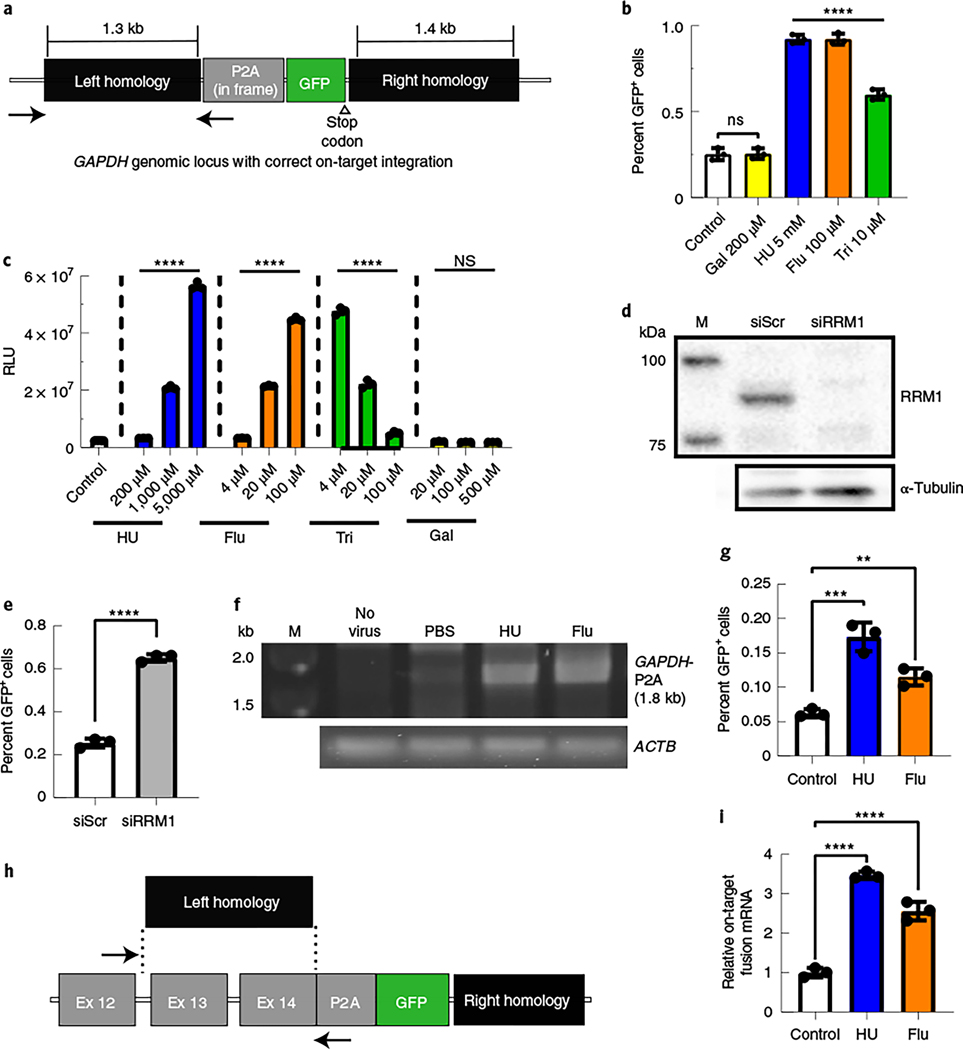
Fig. 1 |. Inhibition of RNR increased the efficiency of gene targeting in human and mouse cell lines.
a, The GAPDH genomic locus after on-target HR with the rAAVDJ-GAPDH-P2A-GFP gene-targeting vector. The positions of in and out PCR primers, to detect site-specific integration, are indicated by black arrows. b, Huh7 cells were treated with RNR inhibitors and transduced with the gene-targeting vector rAAVDJ-GAPDH-P2A-GFP. Flow cytometry analysis of GFP+ fractions was performed after 14 d; Flu, fludarabine; Tri, triapine; Gal, gallium nitrate. Bars represent the group mean, and error bars represent s.d.; n = 3 biological replicate wells. Significance was determined by one-way analysis of variance (ANOVA) with Dunnett’s test for multiple comparisons. P values of all groups were <0.0001, except Gal, which was 0.9998. c, Huh7 cells were treated with RNR inhibitors and transduced with an rAAVDJ vector expressing Firefly luciferase (Fluc) from the CAG promoter. Luciferase activity was measured 24 h later; RLU, relative light units. Data from b and c are representative of two independent experiments. Values are displayed as the group means, with error bars representing s.d.; n = 3 biological replicate wells. Significance was determined by one-way ANOVA analysis with Dunnett’s test for multiple comparisons. d,e, Huh7 cells were transfected with RRM1 small interfering RNA (siRNA; siRRM1) and transduced with rAAVDJ-GAPDH-P2A-GFP; siScr, scrambled siRNA control. Western blotting of RRM1 was performed 2 d after siRNA transfection (d). The GFP+ fraction was analyzed by flow cytometry 3 d after transduction (e). Bars represent the group mean, and error bars represent s.d.; n = 3 biological replicate wells. Data are representative of two independent experiments. Significance was determined using a two-tailed t-test. f, A junction capture PCR was used to detect on-target integration at the GAPDH locus using gDNA extracted from Huh7 cells treated with the indicated RNR inhibitors 14 d after AAV transduction. Control reactions included amplification of the ACTB locus; M, size marker. g, Murine Hepa1–6 cells were treated with RNR inhibitors and transduced with the rAAVDJ-Alb-P2A-GFP targeting vector. Flow cytometry analysis of GFP+ fractions at 14 d after AAV transduction is shown. Bars represent the group mean, and error bars represent s.d.; n = 3 biological replicate wells. Data are from two independent experiments. The HU group P values were 0.0002 and 0.0076 for the fludarabine group. h, The mouse Alb locus after HR with the gene-targeting rAAVDJ-Alb-P2A-GFP vector is shown. The positions of quantitative PCR (qPCR) primers to detect on-target integrated fusion mRNA are indicated; Ex, exon. i, RNA was extracted from transduced Hepa1–6 cells, and qPCR was performed to quantify expression levels of on-target Alb-P2A-GFP fusion mRNA. Actb mRNA was used for normalization, and data are shown as relative expression to control. Bars represent the group mean, and error bars represent s.d.; n = 3 biological replicate wells. Data are from two independent experiments. Significance was determined by one-way ANOVA with Dunnett’s test for multiple comparisons for all data, unless otherwise indicated; *P < 0.05; **P < 0.01; ***P < 0.001; ****P < 0.0001; NS, not significant.

