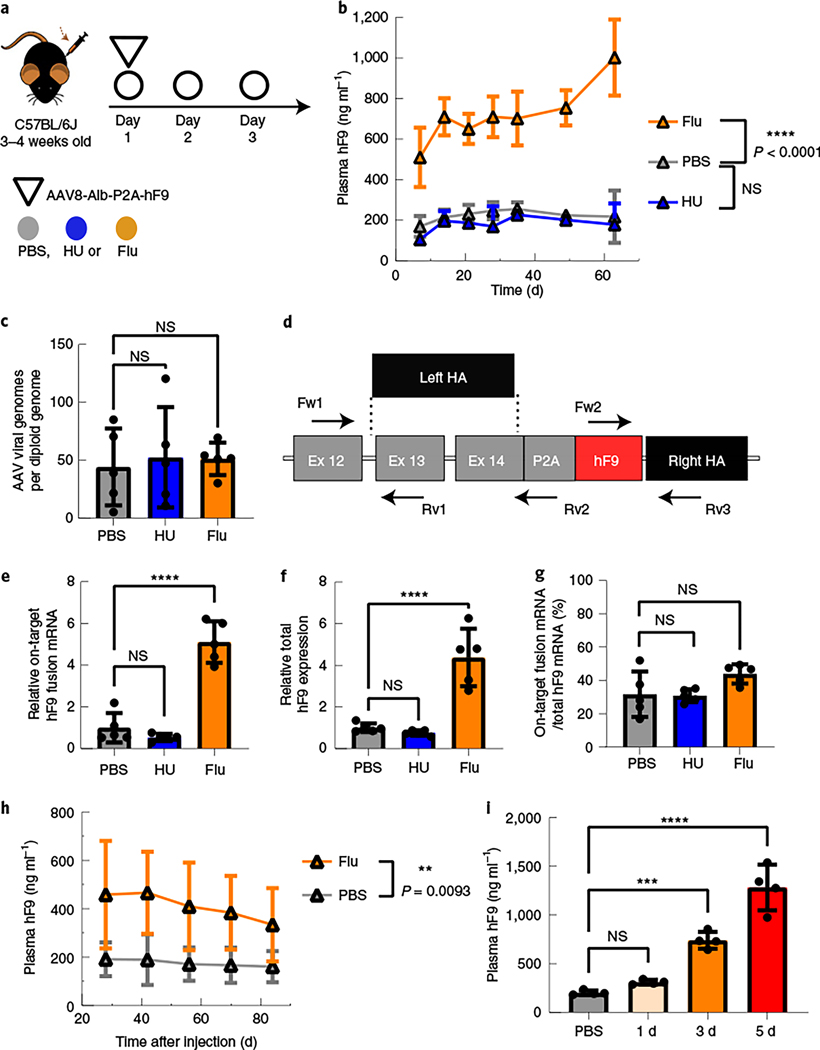
Fig. 2 |. Fludarabine administration increased the efficiency of gene targeting in mouse hepatocytes.
a, Four-week-old mice were administered intraperitoneal (i.p.) injections of HU (300 mg kg–1) once per day or fludarabine (125 mg kg–1) three times per day through day 1 to day 3. Mice were also administered intravenous (i.v.) injections with the rAAV8-Alb-P2A-hF9 targeting vector (1.0 × 10¹¹ viral genomes per mouse) on day 1 immediately after the HU or second fludarabine injection. b, hF9 protein levels in mouse plasma were determined using an enzyme-linked immunosorbent assay (ELISA) following rAAV8-Alb-P2A-hF9 targeting vector injection with or without drug treatment over a 65-d period. Values are displayed as the group mean with error bars representing s.d.; n = 5 mice per group. Significance testing was performed by two-way ANOVA analysis. c, gDNA was extracted from liver tissues 65 d after rAAV8-Alb-P2A-hF9 injection, and qPCR was performed to quantify total AAV genomes. Actb primers were used to quantify mouse diploid genomes. Each point represents data from one mouse. Bars represent the group mean, and error bars represent the s.d.; n = 5 mice per group. Significance testing was performed using a one-way ANOVA analysis followed by Dunnett’s t-test. d, The mouse Alb locus after HR with the gene-targeting AAV-Alb-P2A-hF9 vector is shown. Exon–intron structure and the positions of qPCR primer pairs used for e–g are indicated; HA, homology arm; Fw, forward; Rv, reverse. e–g, Total RNA was extracted from mouse liver tissues in Fig. 2b. qPCR assays quantified the expression levels of on-target integration-derived Alb-P2A-hF9 fusion mRNA (primers Fw1 and Rv2; arrows) (e), total hF9 mRNA (Fw2 and Rv3) (f) and the fraction of hF9 fusion mRNA derived from on-target HR out of the total amount of hF9 mRNA (g). Actb mRNA was used for normalization, and data are shown as relative expression to the PBS-treated group. Bars represent the group mean, and error bars represent the s.d.; n = 5 mice per group. Significance was determined using a one-way ANOVA analysis followed by Dunnett’s t-test, unless otherwise indicated. h, One-week-old male neonatal mice were injected i.p. with PBS or fludarabine (375 mg kg–1) and 4 h later with rAAV8-Alb-P2A-hF9 (2.5 × 10¹³ viral genomes per kilogram of body weight). A second fludarabine dose was given 1 d after vector injection. Four weeks later, plasma was drawn, and hF9 levels were measured by ELISA; n = 6 PBS-treated mice and n = 8 fludarabine-treated mice. Values are displayed as the group mean, with error bars representing s.d. Significance testing was performed by two-way ANOVA. i, Fludarabine dosing regimens were tested by i.p. administration (125 mg kg–1) three times per day for one, three or five sequential days. Four-week-old mice were injected i.v. at day 1 with the rAAV8-Alb-P2A-hF9 targeting vector (1.0 × 10¹¹ viral genomes per mouse) immediately after the second fludarabine administration injection. Blood was collected 2 months later, and hF9 protein levels were determined via ELISA. Values are displayed as the group mean with error bars representing s.d.; n = 4 mice per group (see also Extended Data Fig. 6). Significance was determined using a one-way ANOVA followed by Dunnett’s t-test; *P < 0.05; **P < 0.01; ***P < 0.001; ****P < 0.0001.

