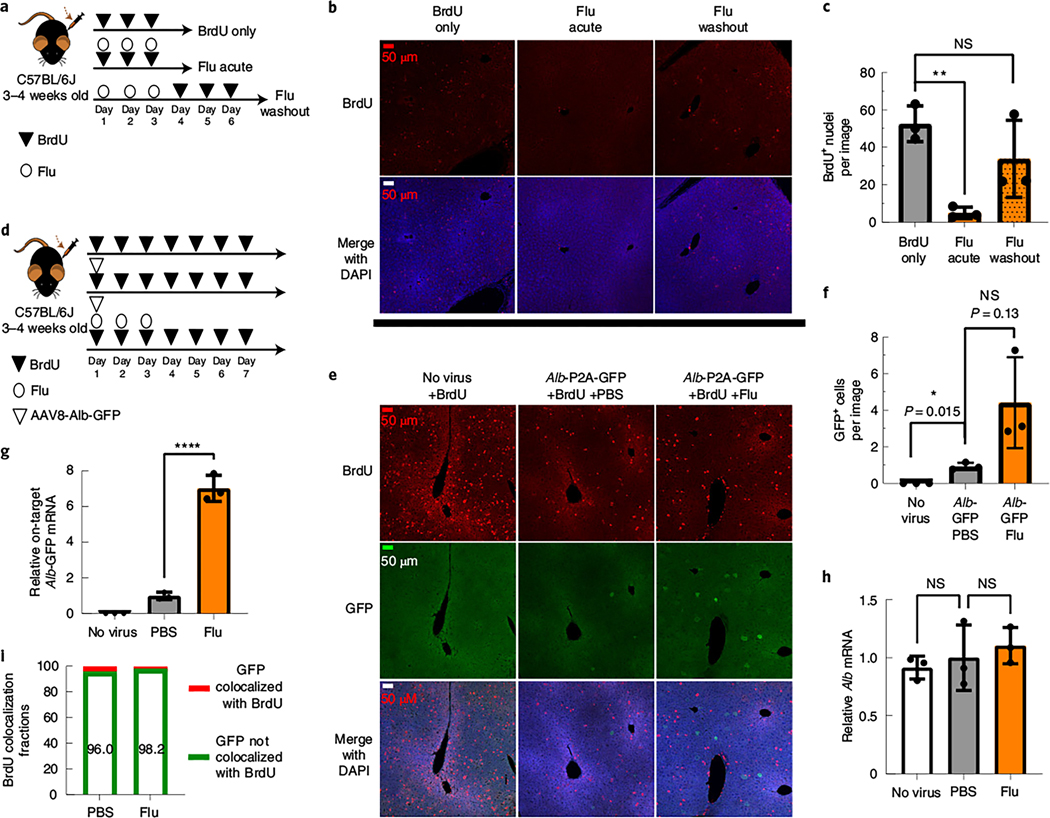
Fig. 3. Fludarabine transiently inhibits S phase progression, and rAAV gene targeting occurs in hepatocytes that have not progressed through S phase.
3 |a, Mice were injected i.p. with BrdU (200 mg kg–1) once per day for 3 d to label proliferating hepatocytes. Some mice were simultaneously injected with fludarabine (125 mg kg–1 three times per day for 3 d), while the final group was treated with fludarabine before the 3 d of BrdU injection; n = 3 mice per group. b, Six hours after the last injection, mice were killed, and livers were collected for immunostaining with anti-BrdU. Representative images from each group are shown with BrdU-labeled nuclei (red) and a DAPI counterstain (blue). All images were taken with a ×20 objective with identical exposure and settings. c, Images of BrdU-labeled nuclei were quantified from each group as the number of BrdU+ nuclei per field of view. Images used for quantification are from two or more slides per mouse, three mice per group and two or more independent strains. Significance was determined using a Shapiro–Wilk test for normal distribution and two-tailed Student’s t-test for normally distributed data or non-parametric Mann–Whitney U-test for non-normally distributed data. Each point represents average data from one mouse; n = 3 per group. Bars represent the group mean, and error bars represent the s.d. The P value of the fludarabine acute group is 0.0012, and the P value for the fludarabine washout group is 0.4. d, To label proliferating cells in the liver, mice were i.p. injected with BrdU once per day for 7 d. On day 1 of BrdU injections, two groups of mice were i.v. injected with the rAAV8-Alb-P2A-GFP targeting vector (1 × 10¹¹ viral genome per mouse). One group was also treated with fludarabine (125 mg kg–1, three times per day) for the first 3 d. e, On day 7, mice were killed, and livers were collected for immunohistochemistry staining of BrdU (red) and GFP (green) with a DAPI nuclear stain (blue). Representative images are shown. f, GFP+ cells were quantified as the number of positive cells per 20× field of view. An F-test was used to determine variance between groups of normally distributed data, and a two-tailed Student’s t-test or t-test with Welch’s correction was used to test for significance. Images used for quantification are from two or more slides per mouse with three mice per group and two or more independent strains. Each point represents average data from one mouse; n = 3 per group. Bars represent the group mean, and error bars represent s.d. g,h, Total RNA was extracted from liver tissue, and qPCR was used to determine the levels of on-target integration-derived Alb-P2A–GFP mRNA and endogenous Alb mRNA, as described previously. Each point represents average data from one mouse; n = 3 per group. Bars represent the group mean, and error bars represent s.d. Statistical testing was performed using a one-way ANOVA followed by Dunnett’s t-test; *P < 0.05; **P < 0.01; ***P < 0.001; ****P < 0.0001. i, The number of GFP+ cells that colocalized with BrdU (that is, the number of cells that have undergone S phase DNA synthesis) were quantified and displayed as the percentage of total GFP+ cells per group.

