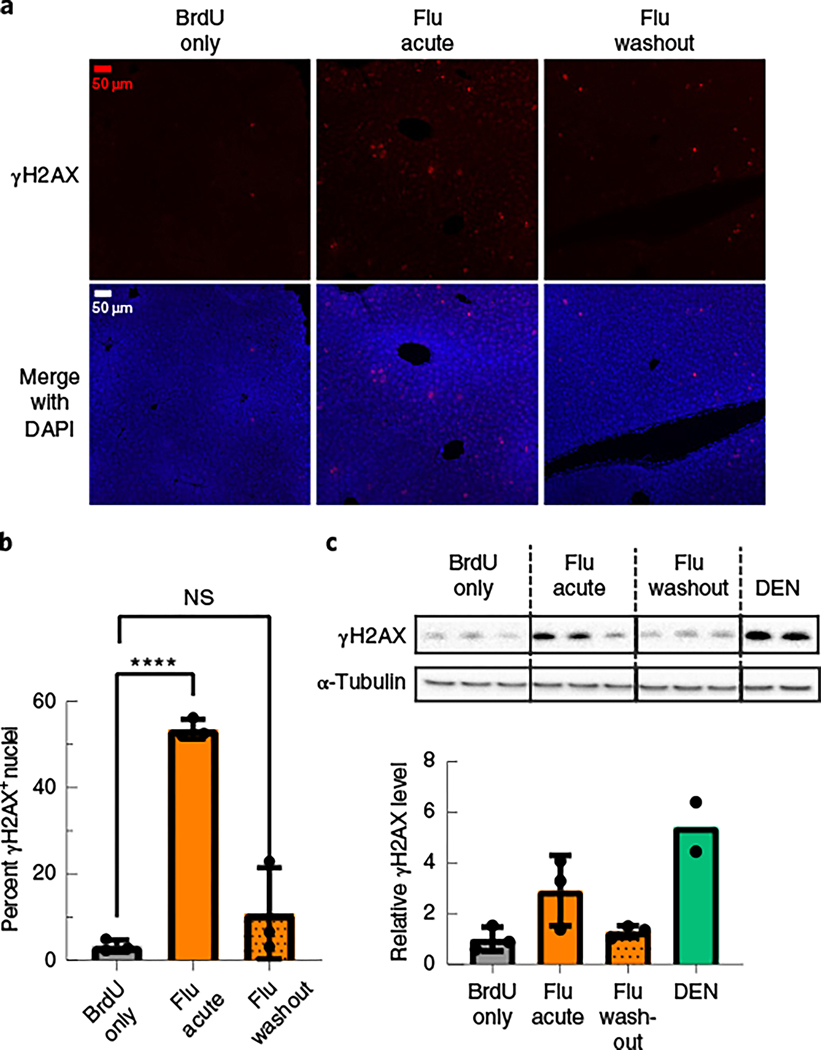
Fig. 4 |. Fludarabine induces a transient DNA damage response in mice.
a, Liver tissue sections from the same mice in Fig. 3a–c were also stained for the DNA damage response marker γH2AX. Representative images are shown with γH2AX (red) and DAPI (blue). b, Images of γH2AX nuclei were quantified from each group and are displayed as the percentage of γH2AX+ nuclei out of all nuclei. Images used for quantification are from two or more slides per mouse, three mice per group and two or more independent strains. An F-test was used to determine variance between groups of normally distributed data, and a two-tailed Student’s t-test or t-test with Welch’s correction was used to test for significance. Each point represents average data from one mouse; n = 3 per group. Bars represent group means, and error bars represent s.d. c, Liver tissue lysates from the same mice were used for western blotting of γH2AX, and α-tubulin was used as a loading control (top). Image analysis quantification of the γH2AX band intensity in the western blot was normalized to α-tubulin (bottom). Each lane (top) and point (bottom) represents average data from one mouse; n = 3 mice per group, except the DEN data, which are two technical replicates from one mouse. Error bars represent s.d.

