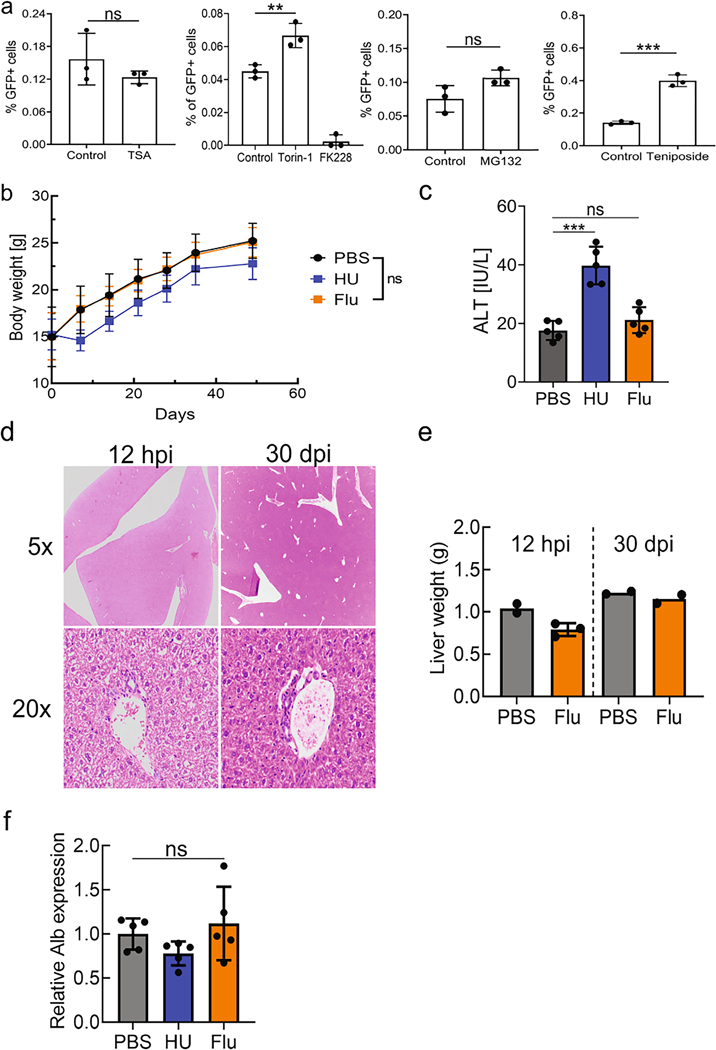
Extended Data Fig. 1 |. rAAV-mediated gene targeting efficiency in vitro with various compounds and the assessment of toxicity from fludarabine or hydroxyurea administration in mice.
a, The effect of each compound on rAAV-mediated gene targeting efficiency was tested in Huh7 cells by treatment with each drug followed by transduction with an AAVDJ gene targeting vector, GAPDH-P2A-GFP. Flow cytometry analysis of GFP positive cells 2 days after treatment is shown. Data is representative of two independent experiments, each with three biological replicates. Data is displayed as the group mean with error bars representing s.d.; n = 3 biological replicate wells. Significance testing was performed by a one-way ANOVA with Dunnett’s multiple comparison test and two-tailed t test. P-value for Torin-1 was .0046, MG132 was .076, TSA was .301, and .0003 for Teniposide. b, Mice were treated with hydroxyurea (HU) (300 mg/kg/day) or fludarabine (Flu) (375 mg/kg/day) for three days. Body weight was monitored over 6 weeks after drug administration. Data is displayed as the group mean with error bars representing s.d.; n = 5 individual mice per group. Significance testing was performed by a two-way ANOVA. c, Serum alanine transaminase (ALT) levels were evaluated 3 days after the last drug administration. Data is displayed as the group mean with error bars representing s.d.; n = 5 mice per group. Significance testing was performed by a one-way ANOVA with Dunnett’s multiple comparison test. P-value for HU-treatment was <0.0001 and .4343 for Flu-treatment. d, Mice were treated with fludarabine (Flu) (375 mg/kg/day) or PBS for three days. Groups of two PBS mice or three fludarabine-treated mice were submitted 12 hours after the final drug injection (hpi). A second cohort of mice was submitted 30 days after injections (dpi). Livers were collected for H&E staining and subsequent blinded analysis by a trained veterinary pathologist. Representative images of H&E-stained liver sections from fludarabine treated mice are shown, at 12 hpi (left column) and 28 dpi (right column). Top panel is images with a 5x objective and bottom panel with a 20x objective. e, Livers were weighed at the time of collection at either 12 hpi or 30 dpi. Hematological analysis of these mice is available in Supplementary Table 2. Each point represents data from one animal with n = 2 or 3 per group from one independent experiment. Error bars represent s.d., where applicable. f, Total RNA was extracted from liver tissue from the animals in Fig. 2. qPCR using primers (Fw1 and Rv1) (Fig. 2d) determined the levels of endogenous albumin mRNA following treatment with PBS, HU, or Flu. Data is shown as the mean and error bars represent s.d; n = 5 animals per group. Statistical testing was performed with a one-way ANOVA analysis followed by Dunnett’s t-test from one independent experiment.

