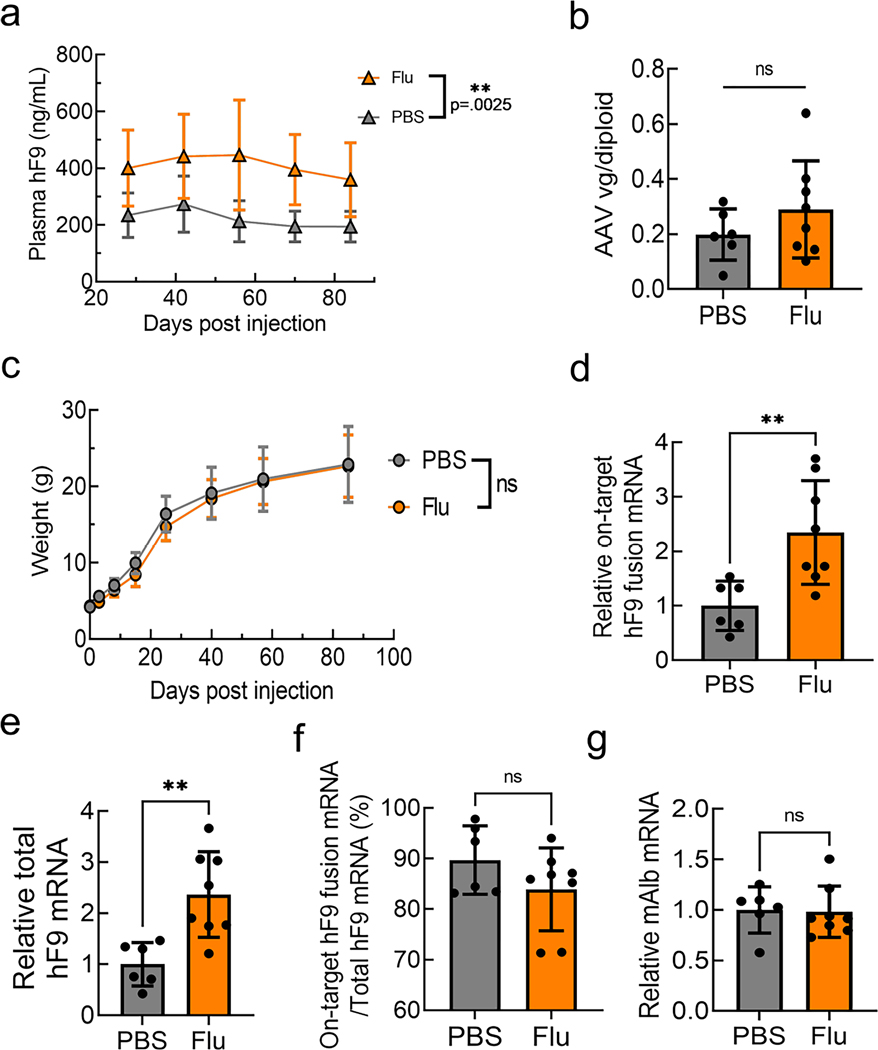
Extended Data Fig. 3 |. Fludarabine treatment increases AAV-HR in neonatal mice.
a, Female neonatal mice were injected with i.p. with PBS or Fludarabine (375 mg/kg) and four hours later with rAAV8-Alb-P2A-hF9 (2.5 × 10¹³ vg/kg) at one week of age. Fludarabine was administered once more, one day after vector injection. Four weeks later, plasma was drawn and hF9 levels measured at various time points by ELISA. Data shown is from n = 9 mice per group and displayed as the group mean with error bars representing s.d. Significance testing was performed by two-way ANOVA analysis. b, Genomic DNA was extracted from liver tissues of male neonates (from Fig. 2h) 84 days after rAAV8-Alb-P2A-hF9 vector injection and qPCR was performed to quantify the amount of total AAV genomes. Actb primers were used for quantification of the number of diploid genomes. Data is displayed as the group mean with error bars representing s.d.; n = 6 PBS-treated and n = 8 fludarabine-treated mice. Significance in all qPCR data in this figure was determined using two-tailed Student’s T tests, after testing for normal distribution with Shapiro-Wilk test and F tests for variance. For all qPCR data Actb mRNA was used for normalization and data is shown as relative expression to the PBS-treated group. c, Male and female mouse weights were monitored following treatment with PBS or Fludarabine and rAAV8-Alb-P2A-hF9. Data is displayed as the group mean with error bars representing s.d.; n = 17 PBS-treated and n = 18 fludarabine-treated mice. Significance testing was performed by 2-way ANOVA analysis. d, On-target fusion hF9 mRNA was quantified from liver tissues of the male mice at the end of the time course, using primers Fw1 and Rv2 (from Fig. 2e). Data is displayed as the group mean with error bars representing s.d.; n = 6 PBS-treated and n = 8 fludarabine-treated mice. A Shapiro-Wilk test was used to test for normal distribution, and F test determined variation between groups, and two-tailed Student’s t-test was used to test for significance in d-g. p-value was .008. e, Total hF9 mRNA was also quantified from the male mice using primers Fw2 and Rv3 (from Fig. 2f). Data is displayed as the group mean with error bars representing s.d.; n = 6 PBS-treated and n = 8 fludarabine-treated mice. p-value was .0035. f, The fraction of hF9 fusion mRNA derived from on-target HR out of the total amount of hF9 mRNA is shown. Data is displayed as the group mean with error bars representing s.d.; n = 6 PBS-treated and n = 8 fludarabine-treated mice. g, mAlb mRNA was quantified from the male mice using primers Fw1 and Rv1 (from Fig. 2). Data is displayed as the group mean with error bars representing s.d.; n = 6 PBS-treated and n = 8 fludarabine-treated mice.

