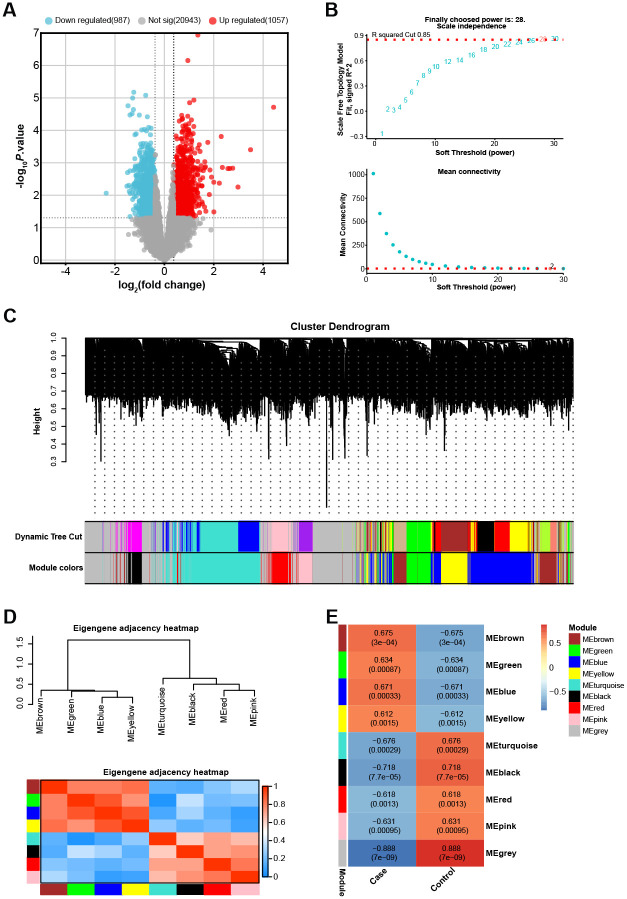
Fig 1. Screening of DEGs and analysis of co-expression network in GSE42148 gene expression profile.
(A) Volcano plot of the 2044 DEGs identified from the GSE42148 gene expression profile, showing 1057 up-regulated and 987 down-regulated DEGs. (B) Analysis of the scale-free fit index for various soft-thresholding powers (β), with β = 28 selected as the most optimal value ensuring a scale-free network. (C) Cluster dendrogram of the DEGs, depicting a total of 8 color-coded modules (excluding the grey module), each representing a cluster of highly interconnected genes. (D) Eigengene adjacency heatmap illustrating the relationships among the identified gene modules. (E) Heatmap of the correlation between the gene modules and the two sample groups in the GSE42148 dataset, orange indicates a positive correlation and blue indicates a negative correlation.

