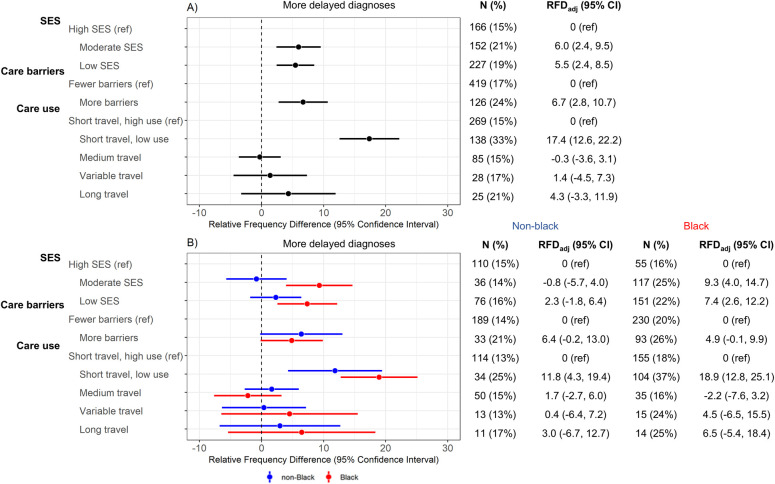
Fig 2. Linear-risk regression models for delayed diagnosis (N = 2,995).
Delayed diagnosis was assessed in relation to latent variables defined for SES (income, education, country of birth, job type, and marital status), care barriers (insurance, urban/rural status, job loss, self-reported financial barriers to care, self-reported transportation barriers to care), and care use (pre-diagnostic regular care, breast cancer screening, mode of initial cancer detection (mammogram vs. noticed lump), and travel (based on estimated driving time) to diagnosis and surgery). Frequency and percentage of delayed diagnosis is reported in “n(%)” columns. Contrast estimates are RFDs and 95% CIs, which compare frequency of delayed diagnosis in a given latent class with the indicated reference group. Results are presented (A) overall and (B) stratified by race; all models are age-adjusted. CI, confidence interval; RFD, relative frequency difference; SES, socioeconomic status.

