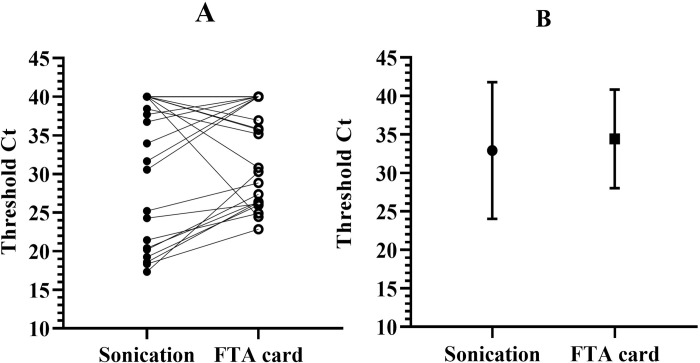
Fig 2. Comparison of threshold cycles between the sonication and FTA card qPCR protocols for detection of IS6110.
Panel A shows the same samples processed by each experimental protocol. qPCR was performed in the standard StepOne instrument. Data is shown as the average threshold Ct for each sample, which was tested in duplicate. Panel B shows mean ± SD for each experimental protocol, averaging all samples.

