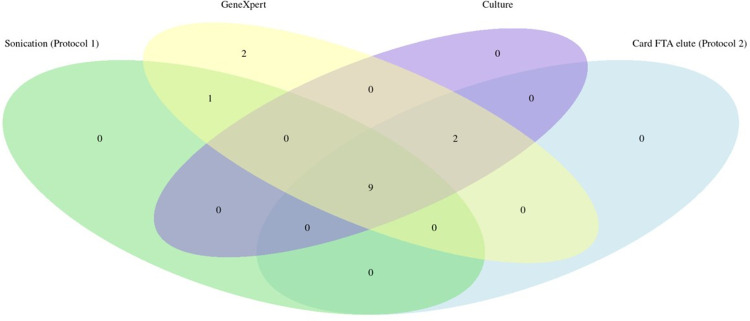
Fig 3. Venn diagram showing the number of samples detected by each technique.
Numbers in overlapping areas indicate that the techniques agreed with the classification, whether the sample was negative or positive. All four techniques equally detected the presence of MTB DNA in 9 samples, while 2 were detected by FTA card protocol, culture, and GeneXpert MTB/RIF assay. One sample was detected only by the GeneXpert MTB/RIF assay and sonication, and 2 were solely detected by the GeneXpert MTB/RIF assay. Raw data is shown in S1 Table.

