. 2024 Dec 16;13:RP99711. doi: 10.7554/eLife.99711

Figure 5. Frequency-dependent shift of glutamate/GABA co-transmission balance of SuM inputs in GCs.

(A, D) Representative traces of EPSCs (Vh = –70 mV) (A) and IPSCs (Vh = 0 mV) (D) in response to 10 light stimuli at 5 Hz (left) or 20 Hz (right) in 2.5 mM (top) or 1 mM (bottom) extracellular Ca2+. (B) Summary graph of normalized EPSC amplitude plotted against the stimulus number in 2.5 mM extracellular Ca2+. Two-way repeated measures ANOVA, F(2,16) = 13.0, p<0.001, n=9 or 10; Tukey post hoc test: ***p<0.001. (C) Same as (B), but recorded in 1 mM extracellular Ca2+. Two-way repeated measures ANOVA, F(2,16) = 11.4, p<0.001, n=9 or 10; Tukey post hoc test: **p<0.01, ***p<0.001. (E) Summary graph of normalized IPSC amplitude plotted against stimulus number in 2.5 mM extracellular Ca2+. Two-way repeated measures ANOVA, F(2,16) = 0.003, p=0.997, n=9. (F) Same as (E), but recorded in 1 mM extracellular Ca2+. Two-way repeated measures ANOVA, F(2,16) = 0.02, p=0.981, n=9. (G) Summary plots showing the normalized amplitudes of 10th EPSCs and IPSCs at 5 Hz, 10 Hz, and 20 Hz in 2.5 mM extracellular Ca2+ (G1: two-way repeated measures ANOVA, F(1,7) = 8.03, #p<0.05, n=9 or 10; Tukey’s post hoc test, EPSC versus IPSC, *p<0.05, **p<0. 01), or in 1 mM extracellular Ca2+ (G2: two-way repeated measures ANOVA, F(1,7) = 21.76, ##p<0.01, n=9 or 10; Tukey’s post hoc test, EPSC versus IPSC, ***p<0. 001). n.s., not significant. Data are presented as mean ± SEM.

Figure 5—source data 1. Source data displayed on Figure 5.

Figure 5.

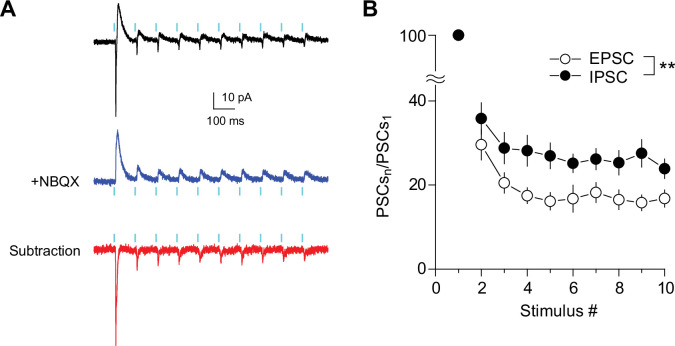
Figure 5—figure supplement 1. Short-term changes in EPSC/IPSC ratio during train stimulation at SuM-GC synapses.

Figure 5—figure supplement 1.

(A) Representative PSCs in response to 10 light pulses at 10 Hz recorded from GC at holding potentials of –30 mV before (black) and after application of 10 μM NBQX (blue). The EPSC (red) was isolated by subtracting the blue trace from the black trace. 1 μM TTX, 500 μM 4-AP, 50 μM D-AP5, 100 μM LY341495, and 3 μM CGP55845 were included in the extracellular solution throughout the experiments. (B) Summary graph of normalized EPSC and IPSC amplitudes plotted against stimulus number. Two-way repeated measures ANOVA, F(1,7) = 17.5, p<0.01, n=8. Data are presented as mean ± SEM. **p<0.01.
Figure 5—figure supplement 1—source data 1. Source data displayed on Figure 5—figure supplement 1.
Figure 5—figure supplement 2. High fidelity activation of ChR2-expressing SuM fibers during trains.

Figure 5—figure supplement 2.

(top) Representative trace of the extracellularly recorded fiber volley from supragranular layer in response to 10 light stimuli at 20 Hz. (bottom) Summary graph of normalized fiber volley amplitude plotted against the stimulus number. 5 Hz: One-way ANOVA, F(9,40) = 0.41, p=0.92, n=5. 10 Hz: One-way ANOVA, F(9,50) = 0.14, p=0.99, n=6. 20 Hz: One-way ANOVA, F(9,50) = 0.35, p=0.95, n=6. Data are presented as mean ± SEM.
Figure 5—figure supplement 2—source data 1. Source data displayed on Figure 5—figure supplement 2.
Figure 5—figure supplement 3. Preventing postsynaptic saturation and desensitization does not alter short-term depression of EPSCs and IPSCs.

Figure 5—figure supplement 3.

(A and B) (left) Representative traces showing EPSCs in response to 10 Hz (A) or 20 Hz (B) light stimulation before (top) and after (bottom) application of 2 mM γDGG. (right) Summary graph of normalized EPSC amplitudes plotted against stimulus number. 10 Hz: Two-way repeated measures ANOVA, F(1,7) = 1.78, p=0.22, n=8. 20 Hz: Two-way repeated measures ANOVA, F(1,7) = 0.65, p=0.45, n=8. (C and D) (left) Representative traces showing IPSCs in response to 10 Hz (C) or 20 Hz (D) light stimulation before (top) and after (bottom) application of 300 μM TPMPA. (right) Summary graph of normalized IPSC amplitudes plotted against stimulus number. 10 Hz: Two-way repeated measures ANOVA, F(1,5) = 1.02, p=0.44, n=6. 20 Hz: Two-way repeated measures ANOVA, F(1,4) = 0.21, p=0.67, n=5. Data are presented as mean ± SEM.
Figure 5—figure supplement 3—source data 1. Source data displayed on Figure 5—figure supplement 3.