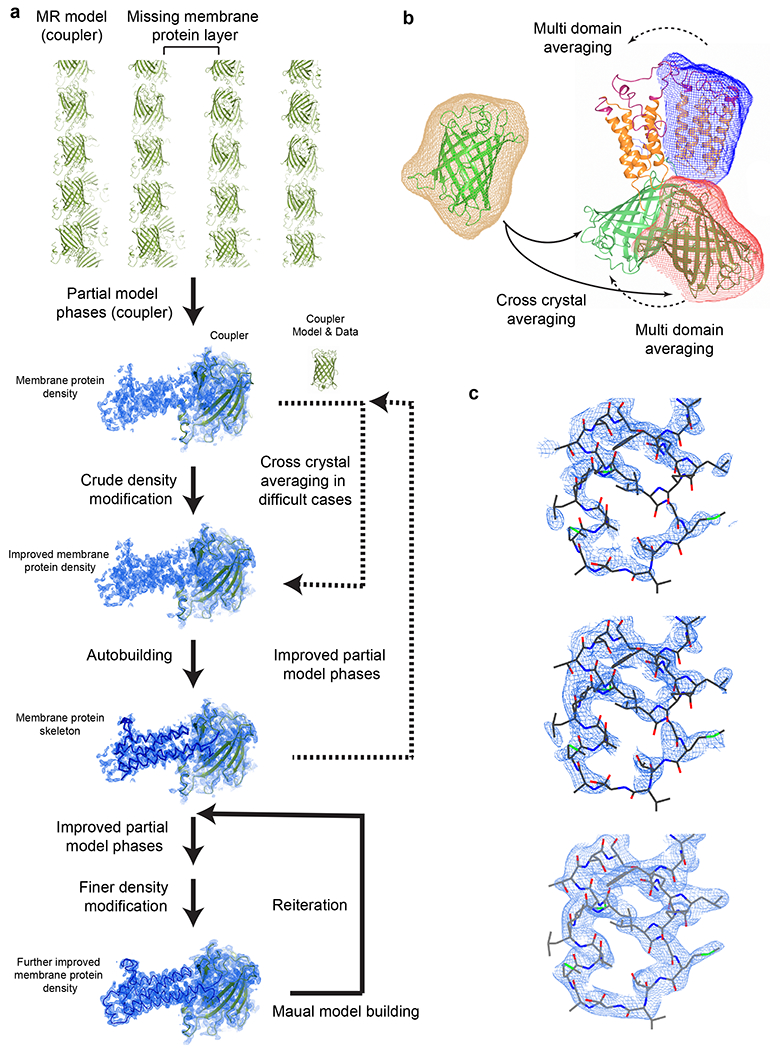
Fig. 4. |. Structure determination using the coupler structure and diffraction data.

a, Structure determination with reiterative density modification procedures. Top to Bottom, molecular replacement locates the coupler molecule in the crystal and the partial model phases are used for initial density modification. This electron density map generally allows automatic model building that generates a large part of the membrane protein skeleton. Advanced density modification strategies (Steps 96-102) and reiterations of phasing and model building generate the final structure. Dashed arrows indicate optional steps. Electron density maps and models of sfGFP-restrained VKORL are shown as an example. b, Averaging strategies. In difficult cases, the structure and diffraction data of the coupler can be used for cross crystal averaging with those of the coupler-fused membrane protein. Only partial phases from the molecular replacement model are required initially (i.e., without knowledge of the membrane protein portion). For NCS related molecules, multi domain averaging is often required to account for the relative movement between the coupler and the membrane protein. The masks on each domain are shown in different colors. c, Zoom view of density maps of the membrane protein region during the structure determination process. Top, 2FoFc map after rigid body refinement of the molecular replacement model (coupler only). Middle, PARROT density modification map using the partial model phase (coupler only). Bottom, 2FoFc map after reiterating model building and density modification. All maps are contoured at 1 σ.
