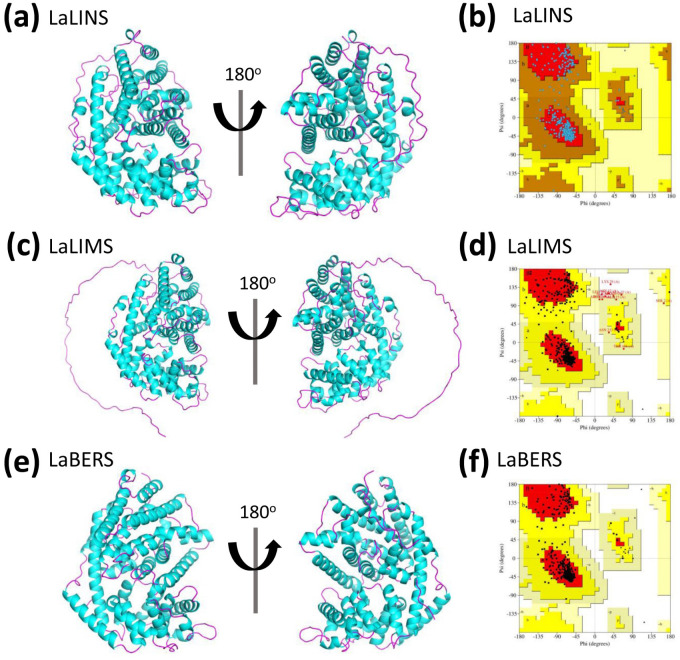
Figure 2.
Prediction and quality assessment of structural model of three terpene synthases. (A, C, E) The three-dimensional (3D) structures are depicted in ribbon representation from two different orientations, with helices and sheets colored pink and cyan, respectively. These 3D structures were predicted using AlphaFold2. (B, D, F) Ramachandran Plot analysis was conducted for structural validation, with the most favorable regions highlighted in red and less favorable regions depicted in progressively lighter shades.

