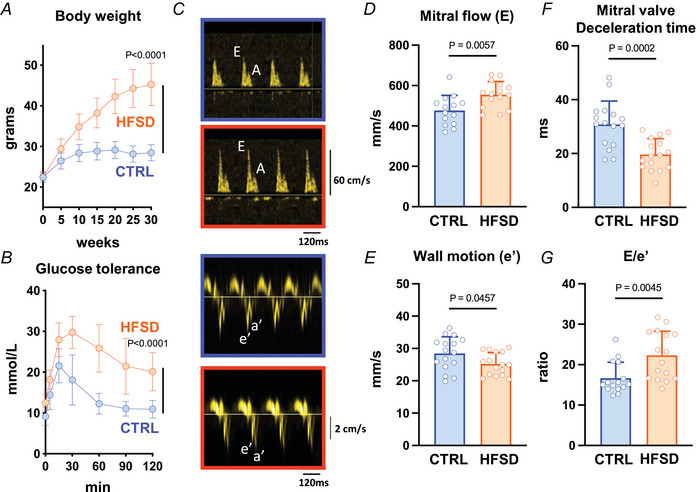
Figure 1. Systemic indicators of cardiometabolic disease and in vivo diastolic function in high‐fat/sugar diet (HFSD) vs. control (CTRL) mice.

A, body weight elevation at 5‐week intervals up to 30 weeks of dietary treatment (last time point full cohort intact; N = 16–17 mice per group). B, glucose tolerance testing at 23–24 weeks’ post dietary intervention; N = 6 mice per group). C, echocardiography exemplar blood flow and tissue Doppler images from which diastolic indices were derived for CTRL and HFSD mice. Panels with orange border: HFSD mitral blood flow and annular wall motion. Panels with blue border: CTRL mitral blood flow and annular wall motion. N = 14–16 mice per group. D, early diastolic mitral annular blood flow (E) was increased in HFSD mice. E, early diastolic mitral annular wall velocity (e′) was decreased in HFSD mice. F, deceleration time of early diastolic mitral annular blood flow was decreased in HFSD mice. G, ratio of early diastolic blood flow to wall velocity (E/e′) was increased in HFSD mice. Time‐course data analysed using two‐way repeated measures ANOVA with Šidák's post hoc test with P‐value for ‘time × diet’ effect presented. Comparisons between two treatment groups performed using Student's t test. Data presented as means ± standard deviation. [Colour figure can be viewed at wileyonlinelibrary.com]
