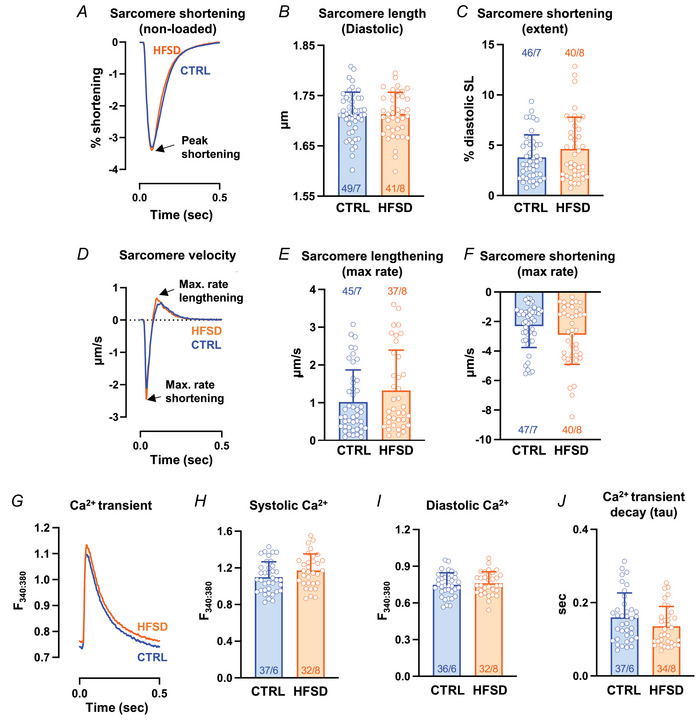
Figure 2. Non‐loaded sarcomere and Ca2+ dynamics in CTRL and HFSD cardiomyocytes.

A, mean sarcomere contraction cycles presented as a percentage of diastolic sarcomere length for CTRL and HFSD cardiomyocytes. B and C, mean diastolic sarcomere length and extent of sarcomere shortening for CTRL and HFSD cardiomyocytes. D, mean sarcomere shortening and lengthening rate records (time derivative of sarcomere contraction–relaxation cycle) for CTRL and HFSD cardiomyocytes. The nadir and zenith represent maximal shortening and lengthening rates respectively. E and F, maximal rate of lengthening and shortening rates for CTRL and HFSD cardiomyocytes. G, mean Ca2+ transient records for CTRL and HFSD cardiomyocytes. H–J, mean Ca2+ levels (systolic and diastolic) and time constant of transient decay (τ) in HFSD and CTRL cardiomyocytes. Mean data computed from average of 20 cycles per cardiomyocyte to derive group mean (N = 6–8 mice per group, n = 32–49 cells per group). Comparisons between two treatment groups performed using Student's t test (all P > 0.05, ns). Data presented as means ± standard deviation. [Colour figure can be viewed at wileyonlinelibrary.com]
