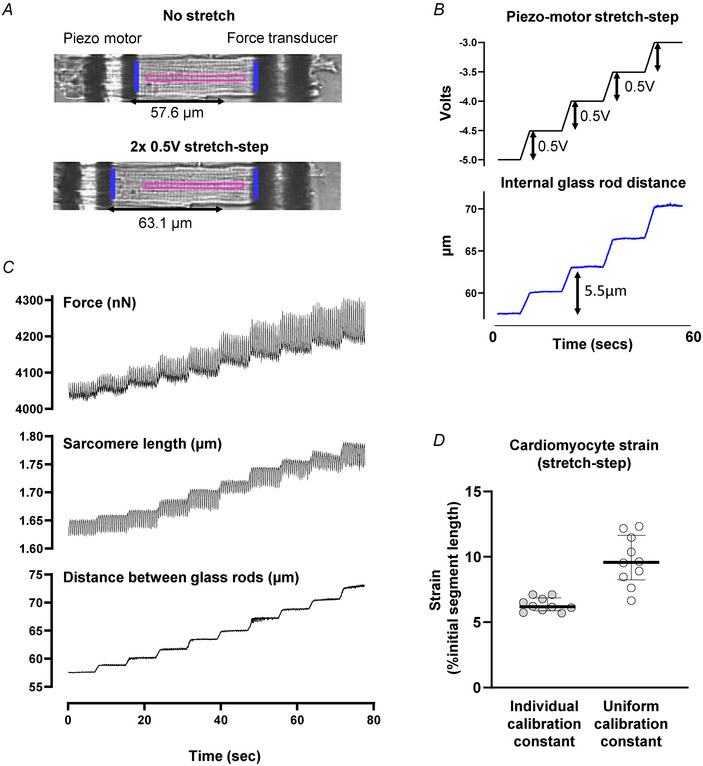
Figure 4. Cardiomyocyte standardized stretch protocol.

A, image of a left ventricular cardiomyocyte longitudinally attached to glass rods. Edge‐tracking used to measure inter‐rod distance (marked as blue bars) for cardiomyocyte segment analyses. The delineated region of interest (marked pink) represents the area from which fast Fourier transform analysis of sarcomere striations was performed to derive sarcomere‐specific data. B, exemplar traces depicting the change in glass rod internal distance in response to successive 0.5 V piezo motor inputs used for calibration of stretch protocol for each individual cardiomyocyte to allow normalized comparisons. C, measurements of stress and strain during progressive cardiomyocyte stretch. Exemplar force, sarcomere length and rod edge‐tracker traces during the first stretch of a stress–length protocol. D, comparison of variability of cell stretches performed using a uniform (pre‐set) stretch constant and the individually derived stretch calibration constant. Strain was measured as the percentage change in segment length relative to the initial segment length. Reproducibility is optimized using the individual stretch calibration constant. Data shown as medians ± interquartile range. [Colour figure can be viewed at wileyonlinelibrary.com]
