
Figure 5. Quantification of diastolic stiffness in CTRL vs. HFSD cardiomyocytes using strain normalization methods.
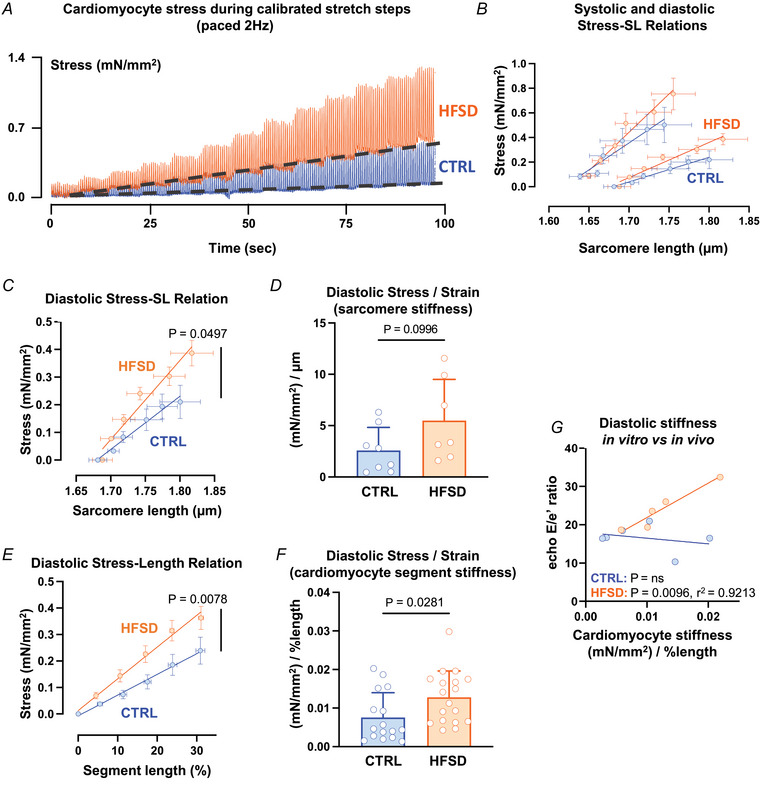
A, exemplar stress recordings of CTRL and HFSD cardiomyocytes undergoing ‘stress–length’ protocol (2 Hz paced). Diastolic baseline stress shifts indicated by dashed line. B, diastolic (pair of lower lines) and systolic (pair of upper lines) sarcomere mean stress–sarcomere length (SL) relations in CTRL cardiomyocytes (N = 5 mice, n = 9 cells). C, diastolic mean stress–sarcomere length relation (linear regression fit) for HFSD and CTRL. D, diastolic stress (mN/mm2) normalized relative to sarcomere stretch (µm) yields sarcomere stress/strain = stiffness ((mN/mm2)/strain (µm)) for HFSD and CTRL. E, diastolic mean cardiomyocyte segment stress–length relation (linear regression fit) for HFSD and CTRL. F, diastolic stress (mN/mm2) normalized relative to segment stretch (% length) yields cardiomyocyte segment stress/strain = stiffness ((mN/mm2)/strain (% length)) for HFSD and CTRL. G, correlation (linear regression fit) of in vitro cardiomyocyte segment diastolic stiffness (stress/strain) with in vivo diastolic dysfunction E/e′ (blood flow/wall motion) in CTRL and HFSD. Cardiomyocyte data averaged per heart. Comparisons between two groups performed using Student's t test. Data fitted with linear regression model and calculation of Pearson's correlation coefficient, presented as means ± standard deviation (D, F) and means ± standard error of the mean (B, C, E). For C and D, CTRL: N = 4 mice, n = 8 cells; HFSD: N = 2 mice, n = 7 cells. For E and F, CTRL: N = 6 mice, n = 16 cells; HFSD: N = 6 mice, n = 18 cells. [Colour figure can be viewed at wileyonlinelibrary.com]