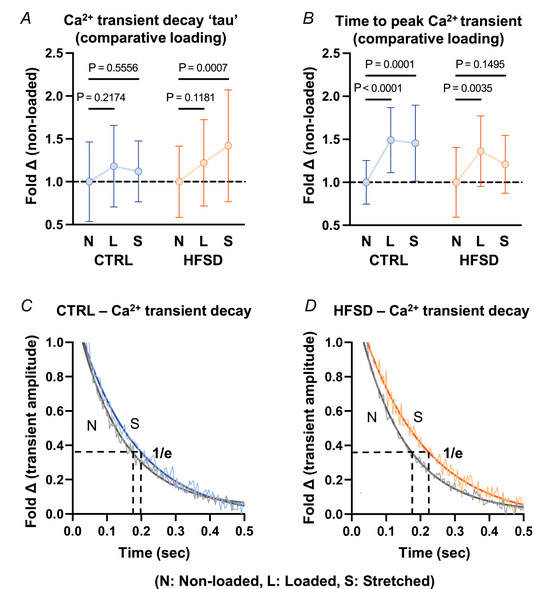
Figure 6. Load dependence of cardiomyocyte Ca2+ transient decay in CTRL and HFSD cardiomyocytes.

A and B, time constant of Ca2+ transient decay (τ) and time to peak Ca2+ transient in cardiomyocytes with different load conditions: loaded (L) and stretched (S) shown as fold change relative to non‐loaded (N) for CTRL and HFSD. C and D, exemplar Ca2+ transient decay records, with a mono‐exponential decay function fit, in non‐loaded and stretched CTRL and HFSD cardiomyocytes. Horizontal black broken lines intersect with mono‐exponential fit at 36.8% (1/e) transient amplitude. Vertical broken lines from intersection points indicate the time constant of Ca2+ transient decay (τ). For analysis of two independent variables a 2‐way ANOVA with repeated measures used (CTRL: N = 5 mice, n = 13 cells; HFSD: N = 4 mice, n = 12 cells). Data are presented as means ± standard deviation. [Colour figure can be viewed at wileyonlinelibrary.com]
