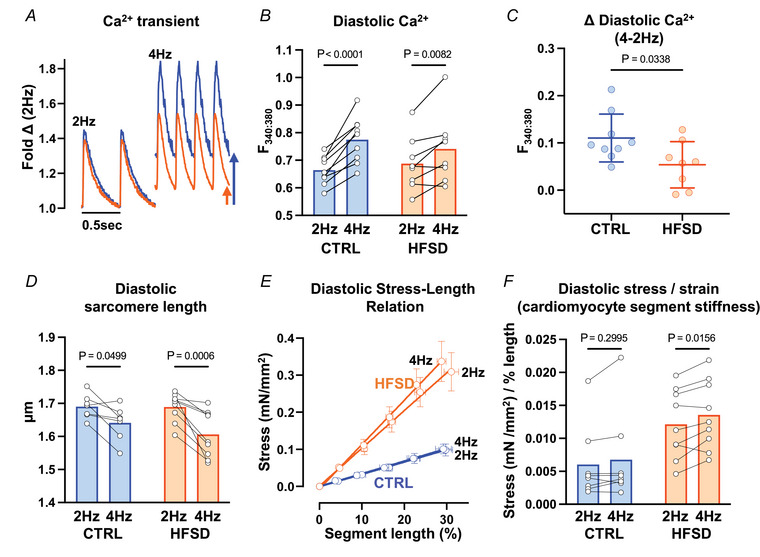
Figure 7. Pacing induced changes in cardiomyocyte cytosolic Ca2+ levels and stiffness in CTRL and HFSD groups.

A, exemplar CTRL and HFSD cardiomyocyte Ca2+ transients at 2 and 4 Hz pacing. B, diastolic cardiomyocyte Ca2+ levels measured before and after transition from 2 to 4 Hz pacing in HFSD and CTRL. C, diastolic cardiomyocyte Ca2+ level mean shift with transition from 2 to 4 Hz pacing in HFSD and CTRL. D, diastolic sarcomere length measured before and after transition from 2 to 4 Hz pacing in HFSD and CTRL. E, diastolic mean cardiomyocyte segment stress–length relation (linear regression fit) for HFSD and CTRL at 2 and 4 Hz pacing. F, diastolic mean cardiomyocyte segment stress–length relation slope (mN/mm2) normalized relative to segment stretch (% length) yields cardiomyocyte mean segment stress/strain = stiffness ((mN/mm2)/strain (% length)) for HFSD and CTRL at 2 and 4 Hz pacing. Comparison between two groups performed using unpaired t test. With two independent variables a repeated measures 2‐way ANOVA Šidák's post hoc analysis was performed. Data are presented as means ± standard deviation (C), means ± standard error of the mean (E) or mean with paired individual points (B, D, F). For B and C, CTRL: N = 4 mice, n = 9 cells; HFSD: N = 4 mice, n = 8 cells. For D and E, CTRL: N = 4 mice, n = 7 cells; HFSD: N = 4 mice, n = 9 cells. For F, CTRL: N = 4 mice, n = 8 cells; HFSD: N = 4 mice, n = 9 cells. [Colour figure can be viewed at wileyonlinelibrary.com]
