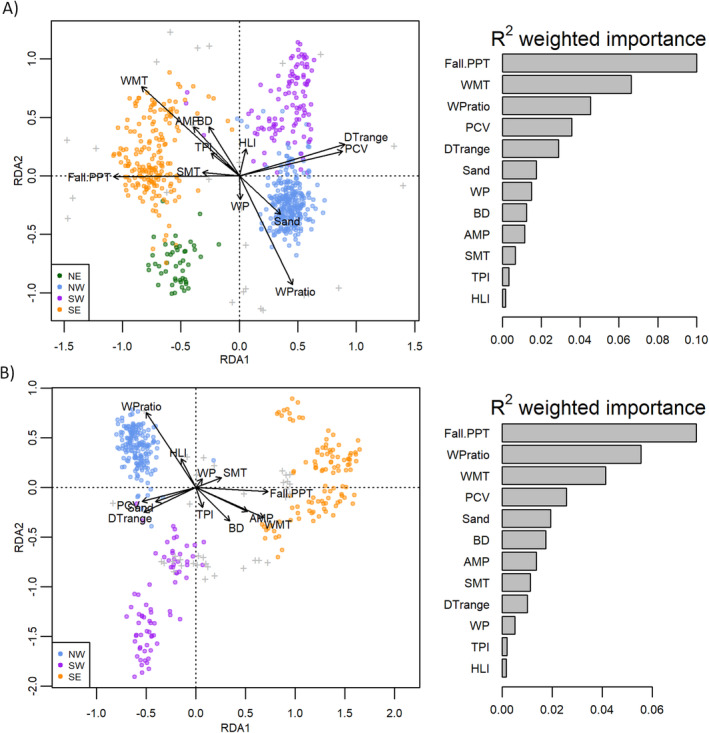
FIGURE 2.

Left panels: RDA biplots from genome scans for selection on the (A) SbfI and (B) PstI datasets. Arrows indicate the strength and direction of associations between allele frequencies and environmental variables. Colors within the biplots correspond to the four genetic populations from ancestry analysis. Tick marks represent loci scores in the ordination. Right panels: GF importance plots showing environmental variables in order of relative R 2 weighted importance. See Table 1 for variable codes.
