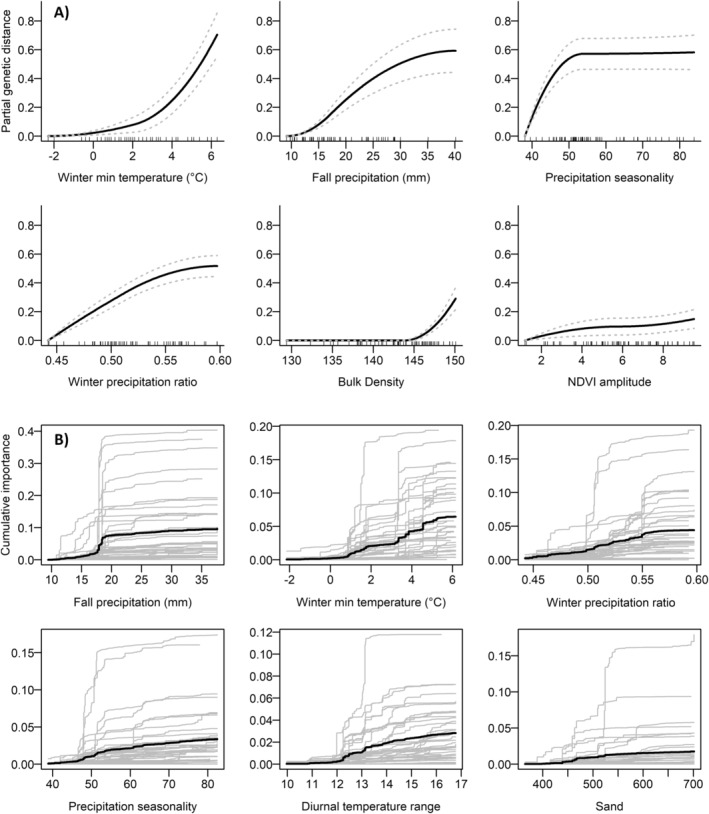
FIGURE 3.

Multivariate models of potentially adaptive allele frequencies for the SbfI dataset. (A) Monotonic I‐splines from GDM. The height of each spline indicates the total amount of allele frequency turnover explained by each predictor, while the slope of each spline indicates the rate of change in allele frequencies along the gradient. Dashed lines indicate standard deviations derived from bootstrapping the GDM models with 999 permutations. (B) Cumulative turnover functions from GF for each environmental predictor (with individual SNP functions shown in light gray). The height of each function indicates variable importance, with “steps” in each curve denoting variable splits of high‐weighted R 2 importance along each gradient.
