Figure 1.
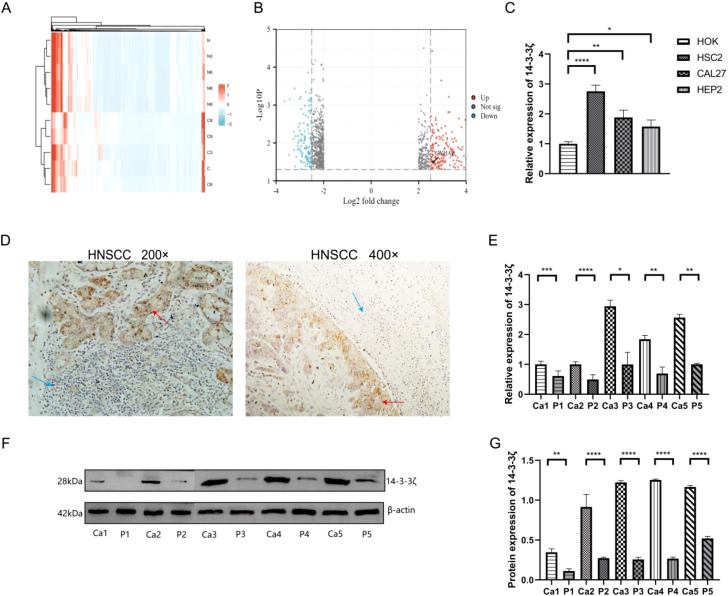
14-3-3ζ is highly expressed in HNSCC tissues and cell lines. (A) The heatmap illustrates the expression of 1,053 differentially expressed mRNAs, of which 377 are upregulated and 676 are downregulated. The colouration gradually transitions from blue to red, indicating increased expression. (B) Volcano plot for the visualisation of the screened differentially expressed mRNAs. (C) RT-PCR was conducted to ascertain the expression of 14-3-3ζ in HNSCC cell lines. (D) Immunohistochemistry was employed to detect the expression of 14-3-3ζ in HNSCC tissues. Red arrows, 14-3-3ζ positive, Blue arrows: 14-3-3ζ negative. (E) RT-PCR was employed to detect the expression of 14-3-3ζ in HNSCC tissues. Ca, cancerous tissue; P, paracancerous tissue. (F, G) Western blotting was employed to detect the expression of 14-3-3ζ in HNSCC tissues. Ca, cancerous tissue; P, paracancerous tissue. Ca, cancerous tissue; P, paracancerous tissue. (n=3, *p<0.05, **p<0.01, ***p<0.001, ****p<0.0001).

