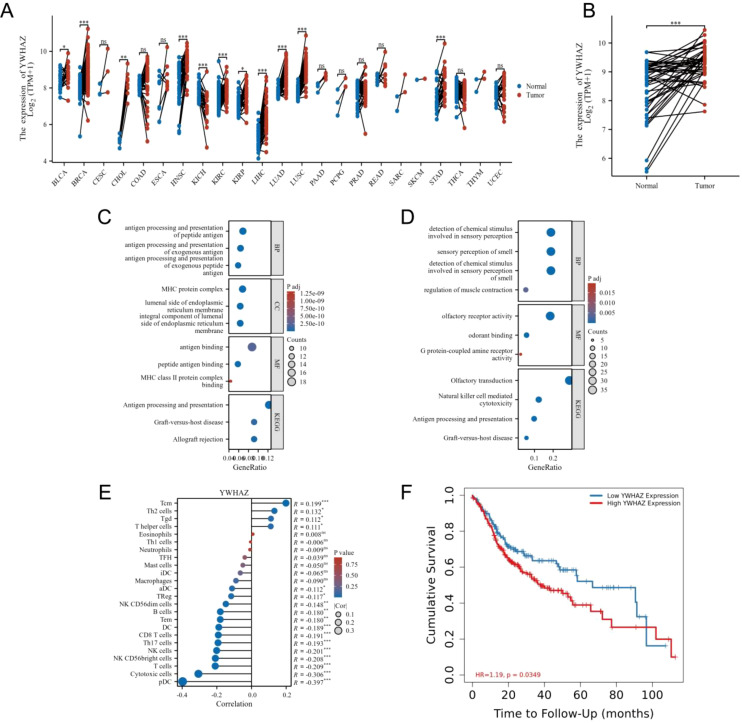
Figure 2.
14-3-3ζ is significantly associated with the development and prognosis of HNSCC. (A) A pan-cancer analysis revealed that 14-3-3ζ expression was markedly elevated in 11 malignant tumours relative to normal tissues. (B) Data from the TCGA database indicated that 14-3-3ζ expression was relatively elevated in HNSCC. (C, D) The selected differential mRNAs were subjected to GO analysis and KEGG enrichment. (E) The infiltration of immune cells in HNSCC in the context of 14-3-3ζ. The relationship coefficient values are represented by dots, with the smallest values labelled from 0 to 0.1 and the most significant values labelled from 0.1 to 0.3. The p-value values are represented by a colour gradient, with the lowest p-values in blue and the highest p-values displayed in red. (F) Effect of 14-3-3ζ on the prognosis of HNSCC. Red represents a high expression of 14-3-3ζ, while green represents a low expression of 14-3-3ζ. (No significance(ns)>0.05, *p<0.05, **p<0.01, ***p<0.001, ****p<0.0001).

