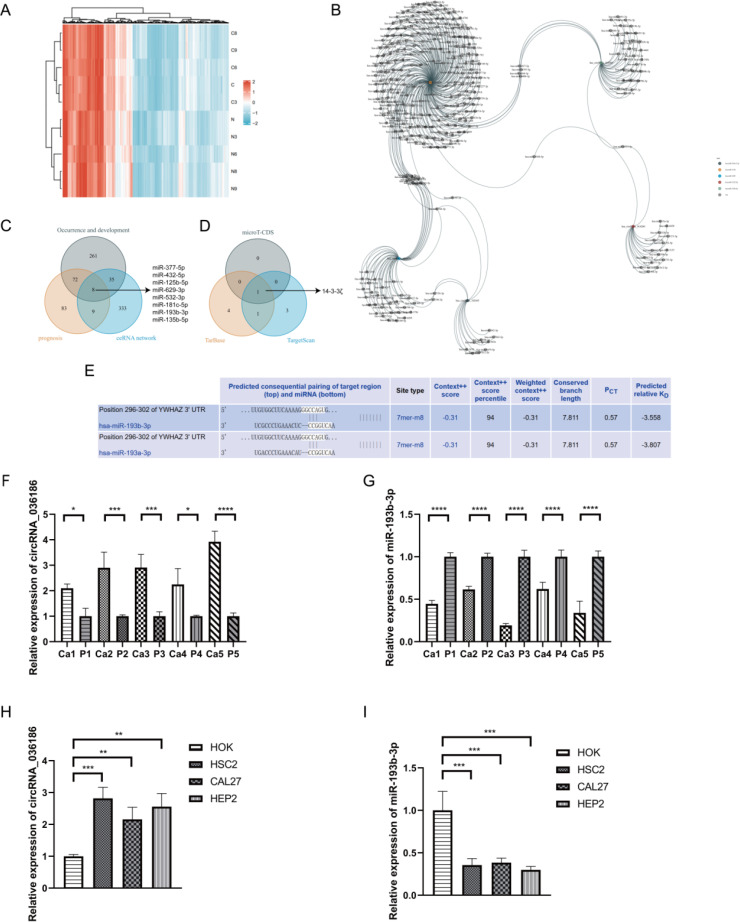
Figure 3.
Identification of circRNA_036186-miR-193b-3p-14-3-3ζ-regulatory axis. (A) The heatmap illustrates the expression profiles of 287 circRNAs, of which 146 exhibited increased expression and 141 exhibited decreased expression. The colouration gradually transitions from blue to red, indicating increased expression. (B) The five most highly ranked circRNAs and their target miRNAs, each corresponding to a node, are shown with two interacting genes based on base sequence pairing connected by a solid line. (C) The intersection results of the HNSCC occurrence and development group, the prognosis group, and the competing endogenous RNA networks in OncomiR. (D) The predicted target mRNAs from three databases—Wayne’s map, miR-193b-3pmicroT-CDS, Tarbase, and TargetScan—were taken as intersections. (E) A search of the Tarbase database revealed that miR-193b-3p has a base sequence that binds and interacts with the 14-3-3ζ target. (F, G) The results of the RT-PCR experiments indicated that circRNA_036186 and miR-193b-3p exhibited elevated expression in HNSCC tissues relative to paracancerous tissues in five pairs of HNSCC and paracancerous tissue samples. (H, I) The results of RT-PCR experiments indicated that the mRNA expression of circRNA_036186 and miR-193b-3p was markedly elevated in all three HNSCC cell lines relative to HOK. (n=3, *p<0.05, **p<0.01, ***p<0.001, ****p<0.0001).

