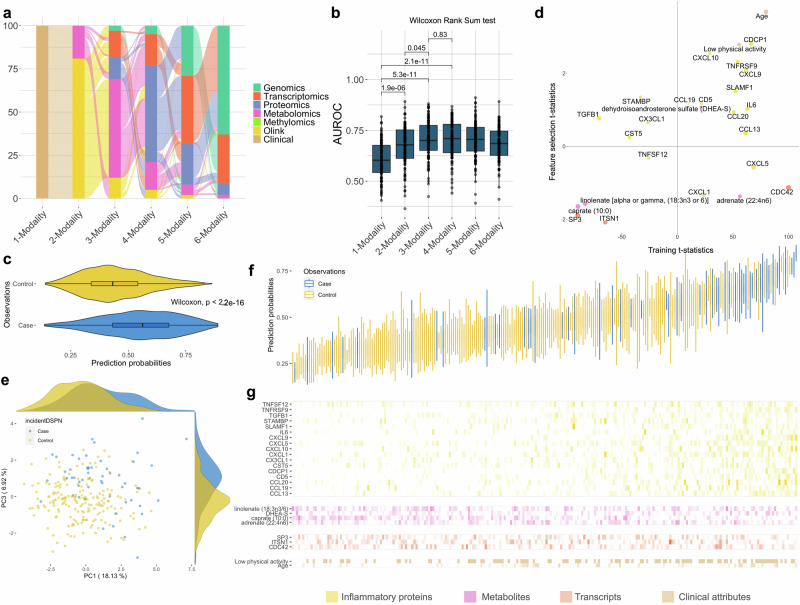
Fig. 3. Predicting DSPN incidence benefits from molecular data.
a Each model starts with clinical attributes at baseline, and consecutively increases the number of modalities by adding the next molecular modality with feed forward selection for 100 cross-validated models (“Methods”). b Performance of all model complexities to predict patient trajectories. Error bars of the boxplot indicate 95% CI. c Prediction probabilities of samples in the 100 left-out testing sets using the optimal mode of the corresponding iterations, stratified into true labels (case and control). d Important features of the final model. x-axis represents the signed model important scores (t-statistics) of the features in the training set, y-axis represents their t-statistics in the feature selection set. e PCA leveraging the most important features of the final model in panel (d). f Waterfall plot of prediction probability of all samples across 100 resampling steps. g Normalised values of the important features in panel (d) stratified by individual samples and ordered according to panel (f). Features belonging to the same data modality are grouped together.

