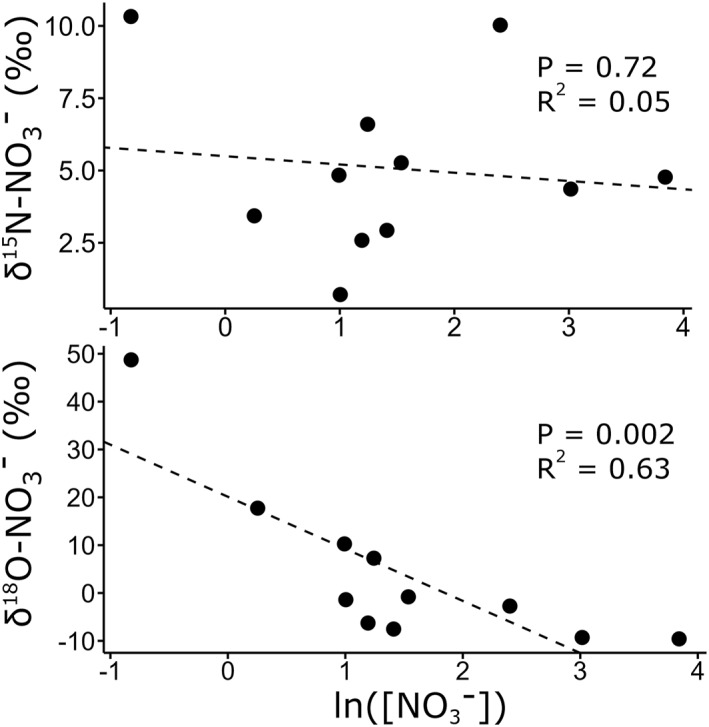
Figure 4.

The δ15N (top) and δ18O (bottom) of NO3 − against ln([NO3 −]) in all rivers sampled. Pearson's correlation coefficient and P are also included.

The δ15N (top) and δ18O (bottom) of NO3 − against ln([NO3 −]) in all rivers sampled. Pearson's correlation coefficient and P are also included.