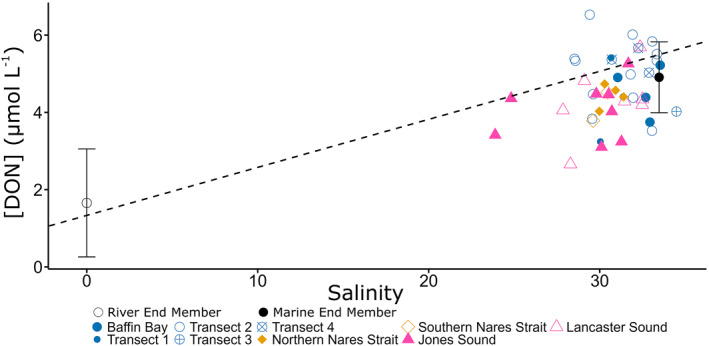
Figure 8.

[DON] (μmol L−1) in the mixed layer (upper 10 m) of the water column versus salinity. Blue dots represent samples located within Baffin Bay, orange diamonds represent samples in Nares Strait, and pink triangles represent samples located in sounds to the east of Baffin Bay. Riverine (hollow) and marine (solid) end members are marked with black dots with solid lines representing the standard deviation for end member estimates. The dashed line represents mixing between the two end members.
