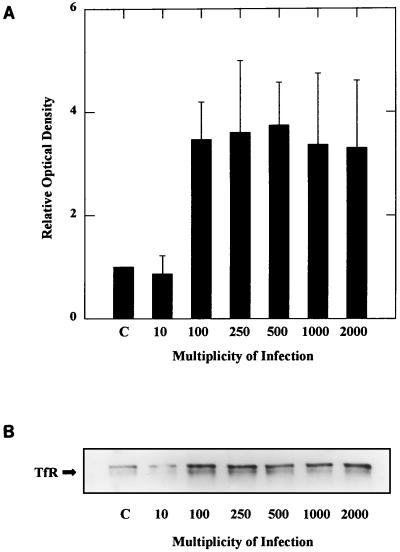
FIG. 1.
(A) To establish that TfR upregulation was not due to the large numbers of internalized C. burnetii necessary for visualization, J774A.1 cultures were infected with viable C. burnetii at the MOI indicated at the bottom. At 12 h postinfection, TfR expression was examined by immunoblot analysis. The optical density of bands on immunoblots was determined by scanning densitometry; the results shown are the means of three experiments, with error bars indicating standard errors. Student t tests indicate that there is a significant difference in the optical density of TfR bands from cultures infected at an MOI of ≥100 with P ≤ 0.05. (B) Representative immunoblot used to generate the data shown in panel A.

