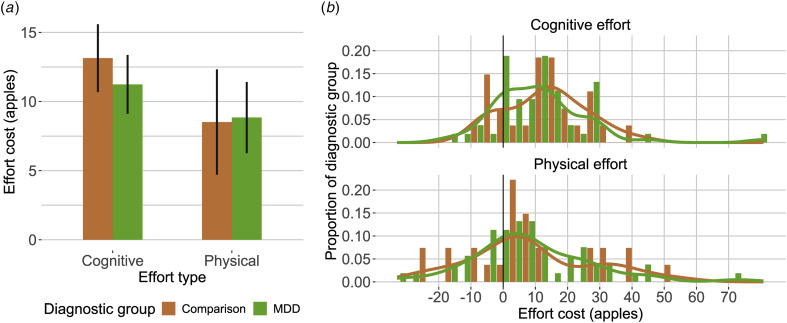
Figure 1.
Effort cost by diagnostic group and effort type. (a) mean and standard error of the mean of individual differences in effort cost (y axis) by effort type (x axis). (b) individual differences histograms, x axis indicates effort cost (larger values indicate more effort avoidance), y axis indicates proportion of diagnostic group.

