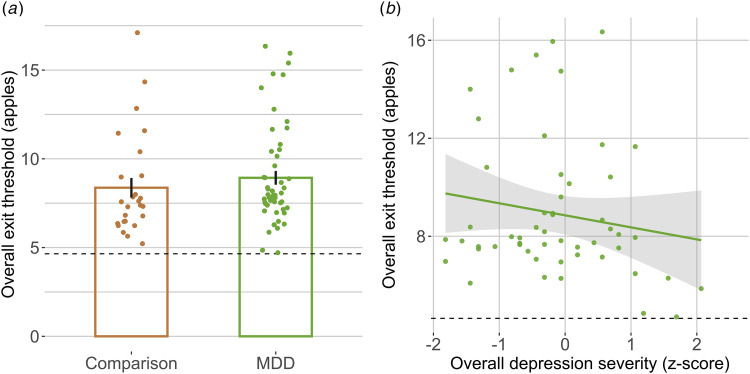
Figure 3.
Relationship of individual MDD symptom domains with overall exit threshold (MDD group only). (a) No diagnostic group differences (x axis) in overall threshold (y axis, apples, estimated from low effort conditions). Bar indicates group means, error bars indicate standard error of the mean, points indicate mean overall exit threshold per participant (i.e. random effects coefficients from linear regression model). (b) Lower overall exit threshold (y axes) was significantly related to overall depression severity (x axes, Hamilton Depression Rating Scale Total z score). Dashed line indicates best threshold policy, linear regression line for MDD group only.

