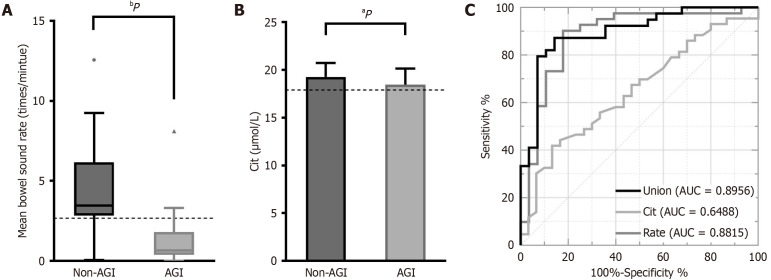
Figure 3.
Area under the receiver operating characteristic curve. A: Shows a significant difference in mean bowel sound rate between the acute gastrointestinal injury (AGI) and non-AGI groups, P < 0.0001; B: Shows a significant difference in citrulline (Cit) level between the AGI and non-AGI groups, P = 0.0337; C: The area under the receiver operating characteristic (ROC) curve of the mean bowel sound rate is 0.8815. The area under the ROC curve of Cit is 0.6488. The critical values are 17.91 μmol/L and 2.665 counts per minute, respectively, as indicated by the dotted lines in A and B. The area under the ROC curve of the mean bowel sound rate combined with Cit level is 0.8956. Cit: Citrulline; Union: Mean bowel sound rate combined with citrulline level; Rate: Mean bowel sound rate; AUC: Area under the curve; AGI: Acute gastrointestinal injury. aP < 0.05, bP < 0.01 vs non-AGI.

