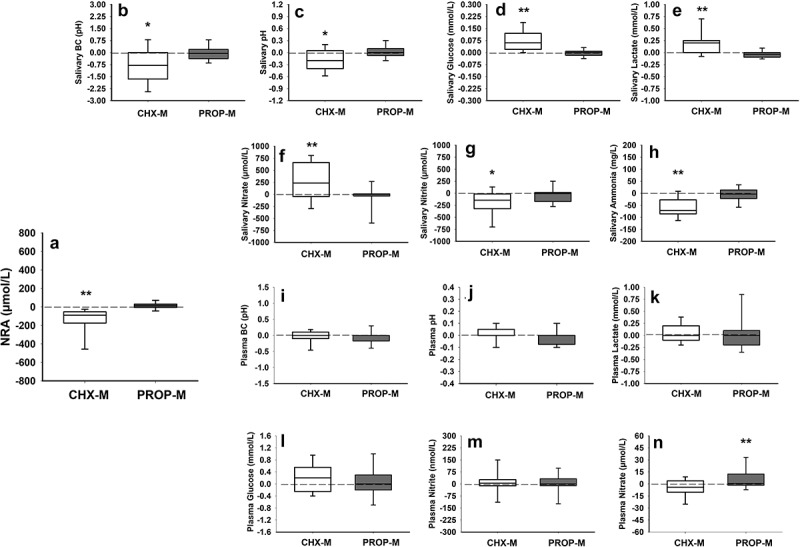
Figure 1.

Changes (delta) (mean ± SD) in nitrite-producing activity (NPA) of oral bacteria (2A) and saliva buffering capacity (BC) (2B), pH (2C), glucose (2D), lactate (2E), nitrate (2F), nitrite (2 G), ammonia (2 h), and plasma buffering capacity (BC) (2I), pH (2J), lactate (2K), glucose (2 L), nitrite (2 M), nitrate (2N) after the chlorhexidine (CHX-M, n = 21) and propolis (PROP-M, n = 24) treatment.
(*represents statistical differences between pre- and post-measurements within the same group; **represents statistical differences between both groups after treatment).
