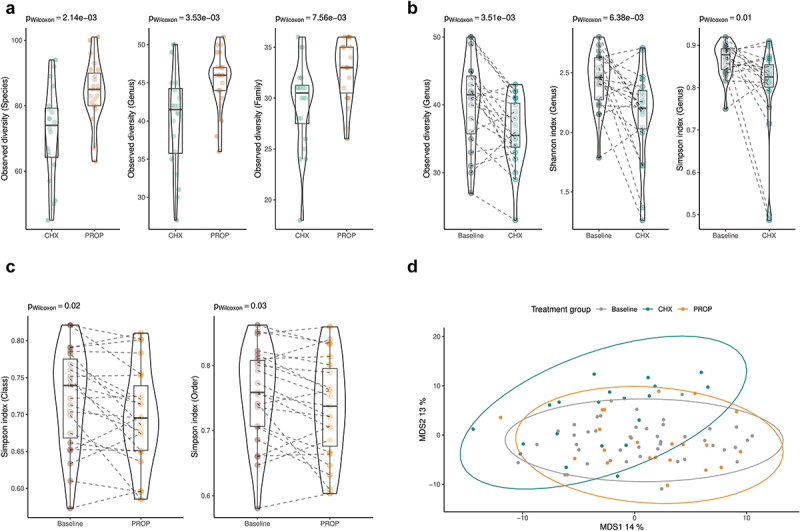
Figure 3.

Observed diversity differences at species, genus and family level in the chlorhexidine (CHX-M, n = 20) and propolis (PROP-M, n = 23) group at baseline (3A). α-diversity (Shannon and Simpson index) in the CHX-M group before and after the treatment (3B). α-diversity (Simpson index) at class level in the PROP-M group before and after the treatment (3C). MDS representation of β-diversity (Aitchinson’s distance) at genus level in the CHX-M (green), PROP-M (orange) and at baseline (gray).
