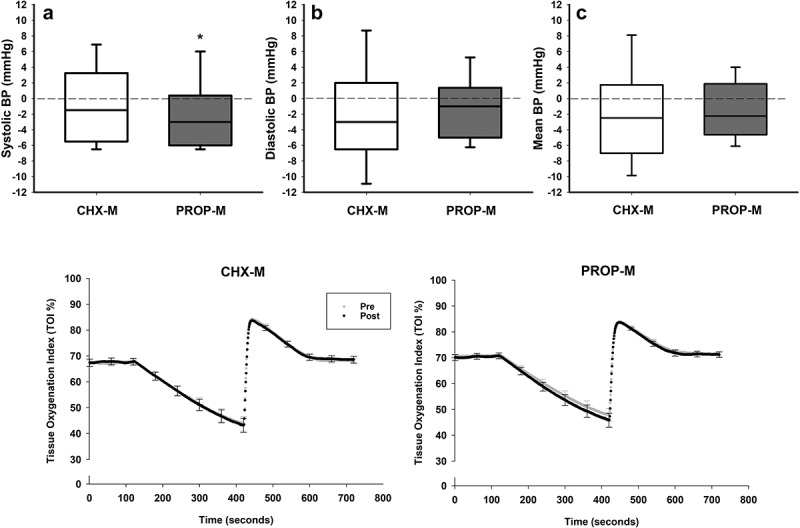
Figure 4.

Top: changes (delta) in systolic (SBP) (4A), diastolic (DBP) (4B) and mean arterial (MAP) (4C) blood pressure after the chlorhexidine (CHX-M, n = 21) and propolis (PROP-M, n = 24) treatment.
Bottom: Microvascular response (mean ± SEM) to a hyperaemia reactive test at baseline (Pre: grey line) and after (Post: black line) the chlorhexidine (CHX-M, n = 21) and propolis (PRO-M, n = 24) treatment.
(*represents statistical differences (p < 0.05) between pre and post measurements within the same treatment).
