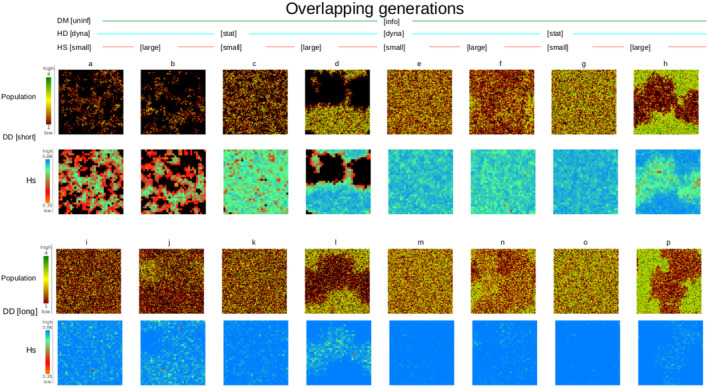
FIGURE 3.

Simulation landscape after 100 years for a population with overlapping generations with 16 scenarios (a–p). Rows are in pairs of (a) population size (1 ha resolution) and (b) heterozygosity (9 ha resolution). The top 2 rows (pairs a–h) display scenarios using short‐distance dispersal and the bottom 2 rows (i–p) long‐distance dispersal.
