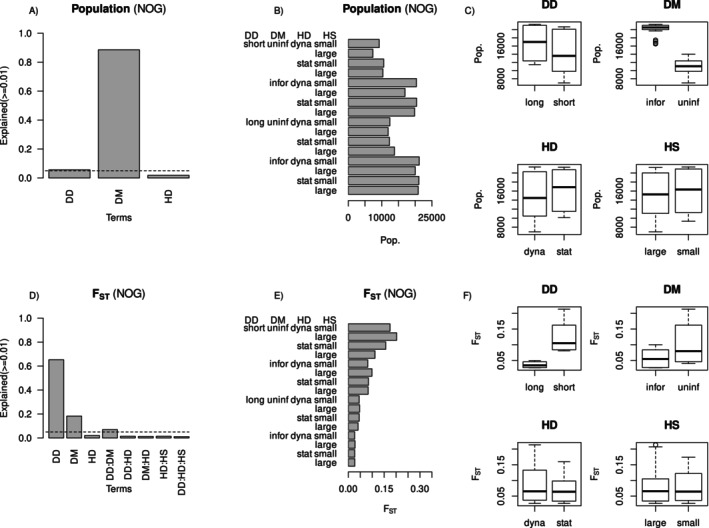
FIGURE 4.

Relative variance explained in (A) population size and (D) F ST by dispersal distance (DD), dispersal method (DM) and habitat dynamics (HD) for non‐overlapping generations (NOG). Dotted lines mark 5% of variance explained. Mean population size and F ST values are shown across treatments for non‐overlapping generations scenarios in panels (B, E), respectively. Panels (C, F) contrast population size and F ST values across the major treatment comparisons including dispersal distance (DD), dispersal method (DM), habitat dynamics (HD) and habitat patch size (HS).
