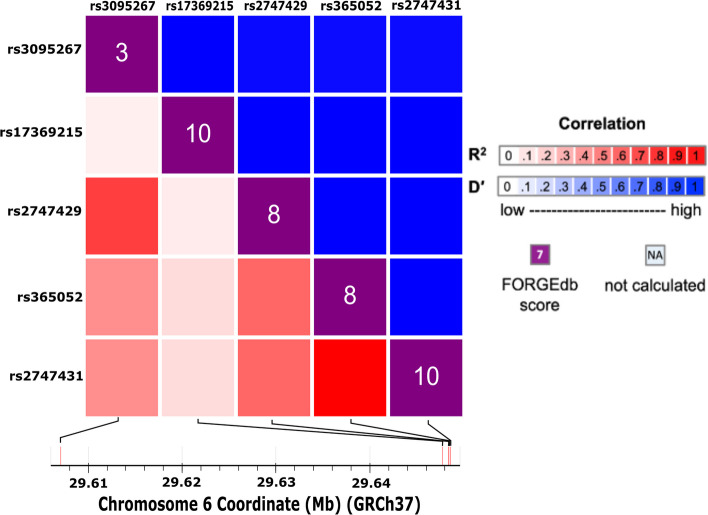
Fig. 6.
Linkage disequilibrium heatmap. Heatmap of data from the 1000 Genomes Project for SNPs in the ZFP57 promoter region. The bottom left squares represent the R.2 values (red) and the top right represents the D’ (blue) values. The intensity of the colour indicates how close the values are to 1 as seen on the right. A score of 1 is classified as complete linkage disequilibrium while 0 is equilibrium. The diagonal line of squares in the middle is the Functional OR Genomic Element Database (FORGEdb) scores which are out of 10 and is used to predict if genetic variants are likely to be regulatory elements. The closer to 10, the more likely this is. The bottom section shows where each SNP is situated on the gene with chromosome coordinates [53]

