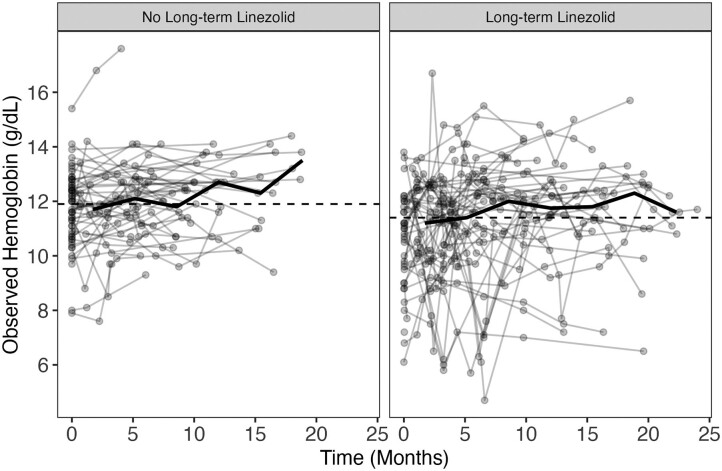
Figure 2.
Hemoglobin concentrations over time grouped by linezolid exposure group. The dashed lines represent overall median hemoglobin, and the solid line represents the change in median over time for each exposure group. Overall median for “no long-term linezolid” and “long-term linezolid” were 11.8 g/dL and 11.4 g/dL, respectively.

