
Figure 3.
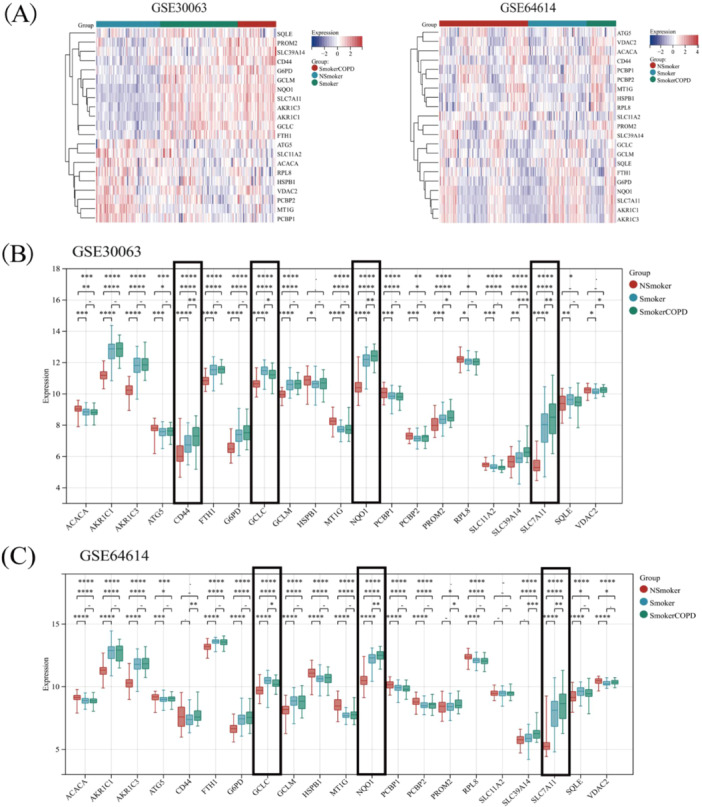
The expression distribution of ferroptosis‐related genes in COPD and control samples. The expression heatmap of ferroptosis‐related genes (A). Ferroptosis‐related genes analysis results by GSE30063 dataset (B). Ferroptosis‐related genes analysis results by GSE64614 datasets (C). *p < 0.05, **p < 0.01, ***p < 0.001, ****p < 0.0001.